ContentsFigures & Tables
During the service life of road infrastructure, natural factors such as rainfall, snow, and earthquakes, together with excessive vehicular loading, anthropogenic construction activities, and geological conditions, can induce subsurface defects, including voids and loosening. Without timely diagnosis, these defects impair road performance, compromise driving comfort, and pose serious risks to public safety and property. Specifically, the concealment and unpredictability of such underground road defects present profound challenges for traffic safety and urban infrastructure management. If left undetected, minor voids can rapidly deteriorate into catastrophic road collapses, resulting in severe traffic accidents and casualties. From a road maintenance perspective, the transition from reactive repair to proactive detection is economically critical; identifying defects at a nascent stage significantly reduces life-cycle maintenance costs and minimizes traffic disruptions caused by emergency repairs. Consequently, the development of high-precision, non-destructive detection technologies is not merely a technical pursuit but a vital imperative for ensuring the resilience and sustainability of modern urban transportation networks. In this context, computer vision techniques enable the extraction of defect information by analyzing subsurface images acquired by imaging systems.
As a subfield of machine learning, deep learning extracts hierarchical representations from data and has achieved substantial progress in image recognition. Convolutional neural networks, leveraging their capacity to automatically learn local features and abstract representations, have become foundational to modern computer vision. Consequently, deep learning is now widely applied to the analysis of ground-penetrating radar (GPR) images [1]. In the realm of object detection, methodologies are broadly categorized into one-stage and two-stage detectors [2]. One-stage methods are exemplified by the YOLO family, while two-stage methods are represented by the faster R-CNN framework [3]. Within the two-stage domain, Pham et al. [4] employed faster R-CNN to detect subsurface objects in GPR imagery, demonstrating the strong potential of this approach. Xu et al. [5] proposed a faster R-CNN-based model for roadbed defect detection, integrating feature cascading and data augmentation strategies to enhance accuracy and robustness. Similarly, Niu et al. [6] applied a deep learning approach to enhance the intelligent recognition of GPR images for urban road detection. Conversely, regarding one-stage detection, Redmon et al. [7] introduced YOLO as a real-time, end-to-end framework. Ni et al. [8] adopted YOLOv3 for void detection in urban roads, yielding high recall and detection speeds. Mehta et al. [9] applied YOLOv3 to GPR B-scan images for the detection of pipelines, pavement defects, and cavities, achieving a mean accuracy of 0.74. Hu et al. [10] utilized gprMax to simulate tunnel-lining voids and leakage defects, employing YOLOv7 to automatically identify their distinct features. Despite these advances, the inherent complexity and high computational demands of GPR data challenge conventional deep learning models in balancing accuracy with efficiency, thereby complicating edge deployment and constraining real-time performance.
To address the trade-off between accuracy and computational cost in subsurface road-defect detection, extensive research has been conducted. Feng et al. [11] applied faster R-CNN and YOLOv3 to GPR image recognition, reporting comparable mean detection accuracy but superior inference speed for YOLOv3. Yi et al. [12] proposed an improved YOLOv7 incorporating the SimAM attention module, Ghost operators, and the SIoU loss to simultaneously enhance accuracy and speed in defect detection. Fang et al. [13] addressed the limited localization capability of lightweight detectors for subsurface pipeline hyperbolas by optimizing YOLOv8, achieving a 15-fold increase in speed and a substantial gain in accuracy on field datasets. Despite these advances in lightweight modelling for subsurface defect detection, notable challenges remain.
In summary, while prior two-stage detectors [4–6] have established the feasibility of high-precision GPR analysis, and one-stage models [7–13] have advanced the efficiency required for real-time applications, a unified framework capable of reconciling these conflicting demands remains elusive. Furthermore, few existing studies adequately address the specific physical challenges posed by signal attenuation and complex geological clutter in subsurface environments. Specifically, three primary challenges persist:
Data scarcity and interpretation. The scarcity of publicly available GPR datasets for roadbed often results in imprecise annotation. Furthermore, the high visual similarity among distinct defect signatures complicates feature discrimination, thereby reducing training accuracy.
Generalization and adaptability. Limited diversity in data acquisition conditions prevents the capture of varied defect manifestations under changing environmental contexts, thereby constraining model generalization across heterogeneous scenarios.
The accuracy-efficiency trade-off. GPR data are inherently characterized by complex noise. Developing methods that effectively segregate noise from salient defect features—without incurring significant information loss—remains essential for balancing detection precision with computational efficiency.
To address the aforementioned challenges, we first established a classification scheme for subsurface road defects and acquired in-situ GPR data using the GS8000 system. To mitigate class imbalance within the empirical dataset, gprMax was utilized to generate high-fidelity synthetic samples for underrepresented defect categories, thereby ensuring training adequacy. Second, data augmentation—including cropping, scaling, rotation, and contrast adjustment—was implemented to simulate variations in signal characteristics and environmental conditions, thereby enhancing dataset diversity and model generalizability. Finally, to reconcile the trade-off between detection accuracy and computational efficiency, we propose MARD-Net, a framework comprising three core innovations: (1) a multi-path coordinate attention (MPCA) module that jointly captures global and local contextual cues to minimize information loss and strengthen feature representations; (2) a re-parameterized cross-stage partial efficient layer aggregation network (RepNCSPELAN4_CAA), which enhances the multi-scale fusion of MPCA-derived features through computational reuse while maintaining low latency; and (3) an improved lightweight asymmetric detection head (LADH) that optimizes the equilibrium between feature-fusion efficiency and spatial precision, reducing computational overhead without compromising accuracy. The synergistic integration of these components facilitates the precise detection of subsurface road defects.
To address the limitations associated with the scarcity and imprecise annotation of existing GPR data, we constructed a proprietary dataset (subData) comprising 4,274 accurately annotated defect images. These images were collected from over 40 km of asphalt pavements across Zhejiang Province, China, encompassing diverse scenarios—including bridges, rural roads, and expressways—under varying seasonal conditions and pavement service lives. This variability ensures the inclusion of challenging detection conditions, characterized by fluctuating defect severity, varying spatial density, and diverse background noise levels, thereby substantially enhancing the dataset's generalizability.
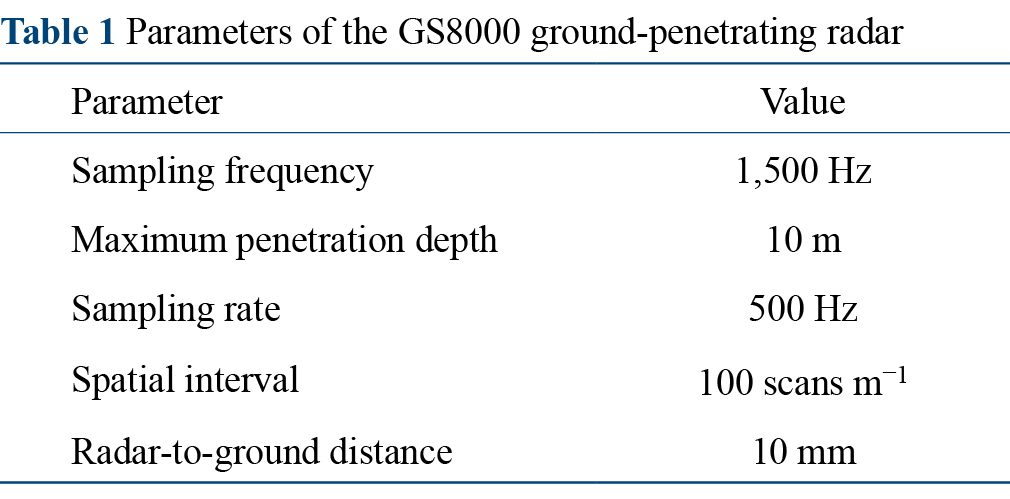
The empirical field data were acquired using the two-dimensional ground-penetrating radar (GS8000, Proceq SA, Schwerzenbach, Switzerland). The system operated in free-scan mode with a sampling frequency of 1,500 Hz, an effective bandwidth of 3,200 MHz, offering a minimum detectable target size of 0.1 cm and a maximum penetration depth of 10 m. The sampling rate was set to 500 Hz, with a Global Navigation Satellite System (GNSS) initialization time of 15 s, and a spatial sampling interval of 100 scans m-1. Detailed radar configuration parameters are provided in Table 1.
Field data were collected on roads in Zhejiang Province using the GS8000 system initialized with the aforementioned parameters. Considering an average road width of 12 m, the lateral spacing between adjacent survey lines was established at 2 m. The radar system traversed multiple 5 km road sections bidirectionally at this interval, yielding six continuous 5,000 m B-scan profiles. Subsequently, image segments with a depth range of 0–1.5 m and a horizontal length of 2.5 m were extracted for analysis. The data acquisition protocol is schematically illustrated in Figure 1A.
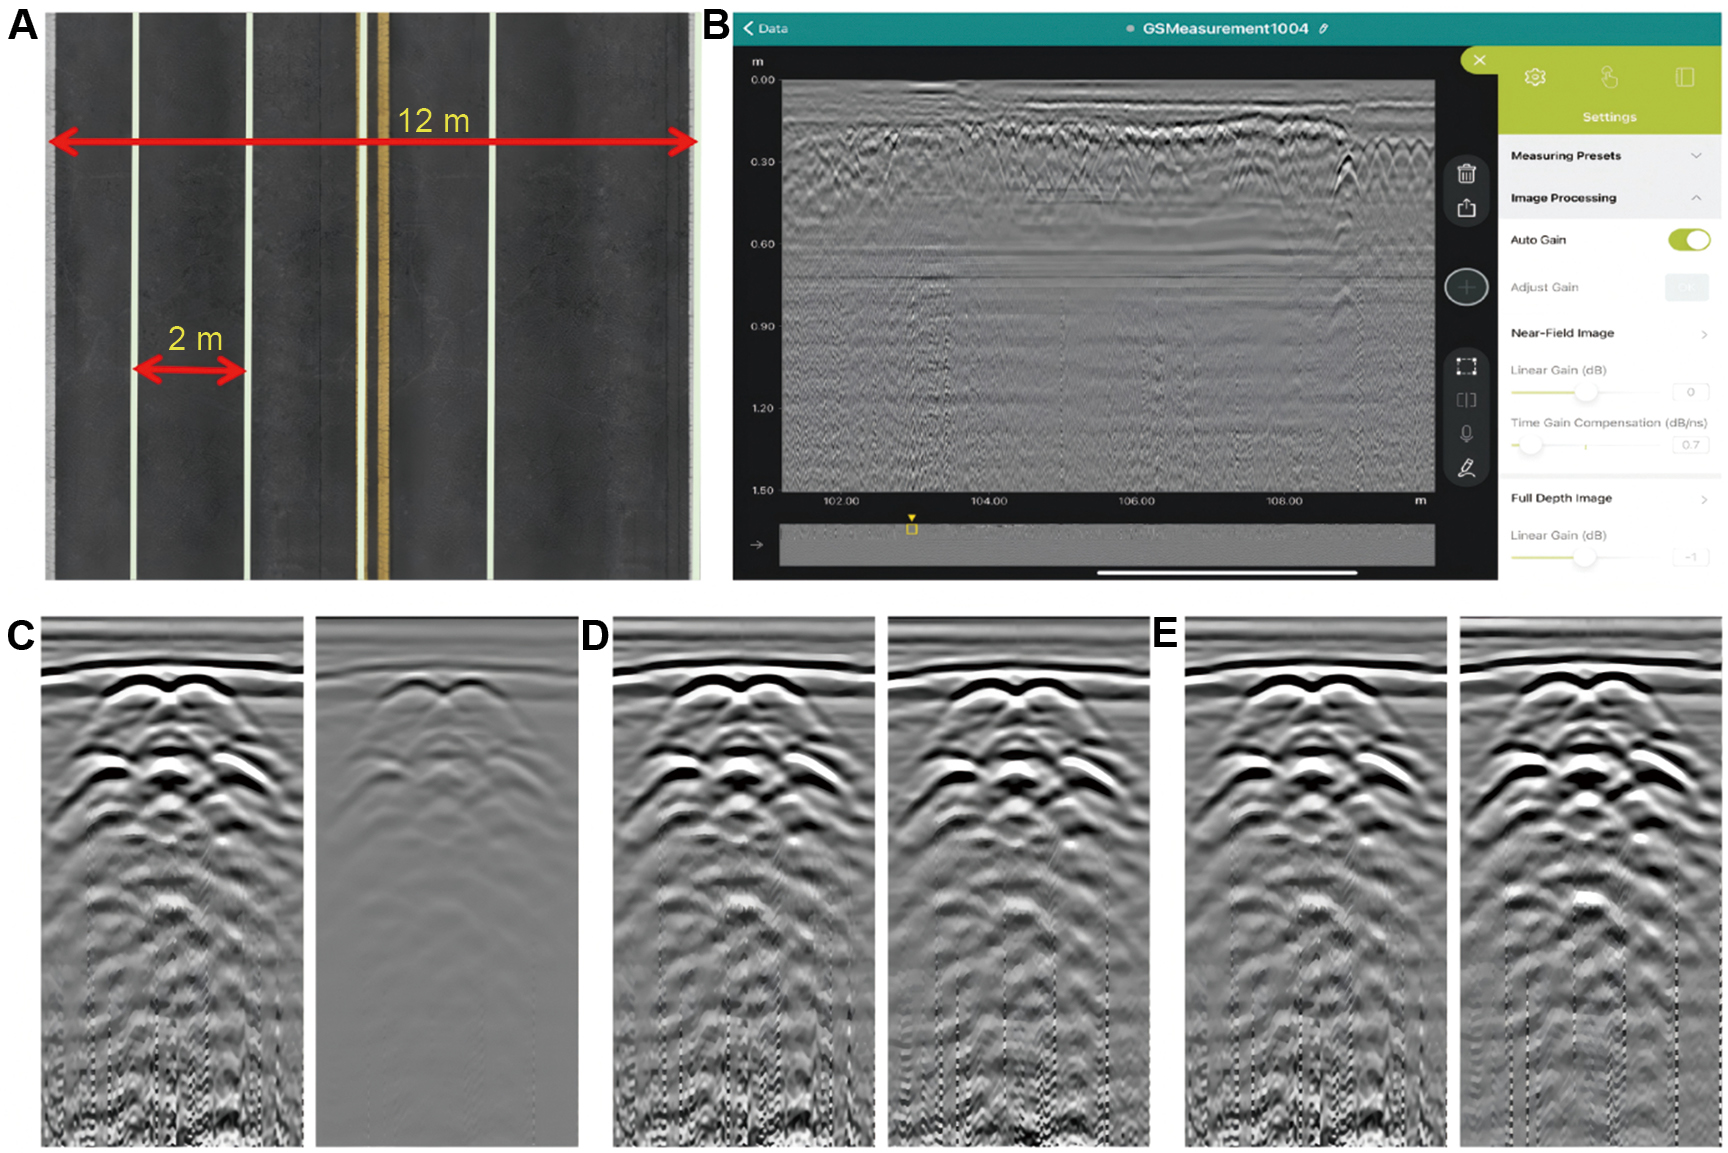
Raw GPR data inherently consist of electromagnetic reflections that capture both salient target information and substantial noise arising from various subsurface heterogeneities. To facilitate downstream analysis, specific signal processing filters were applied to suppress clutter and enhance target features. The data preprocessing workflow, implemented using Proceq software, is illustrated in Figure 1B.
Noise suppression mitigates background clutter through filtering or signal reconstruction. Specifically, redundant deep-layer textures are analyzed to isolate and eliminate statistically insignificant noise artifacts, and smoothing or interpolation is applied to ensure data continuity in processed regions. This process enhances signal coherence and accentuates reflections from subsurface targets (Figure 1C).
Contrast enhancement accentuates target features by optimizing the grayscale dynamic range. By analyzing the global gray-level distribution, the contrast is stretched or modified to amplify the intensity disparity in target regions. This clarifies subsurface reflection patterns and facilitates the interpretation of subtle structural variations (Figure 1D).
Noise injection augments the dataset by introducing simulated interference. The signal characteristics of the original GPR data are analyzed, and synthetic noise—generated according to a predefined noise model (e.g., Gaussian)— is superimposed onto the original B-scans. This simulates random interference typical of complex detection environments, thereby enhancing model robustness (Figure 1E).
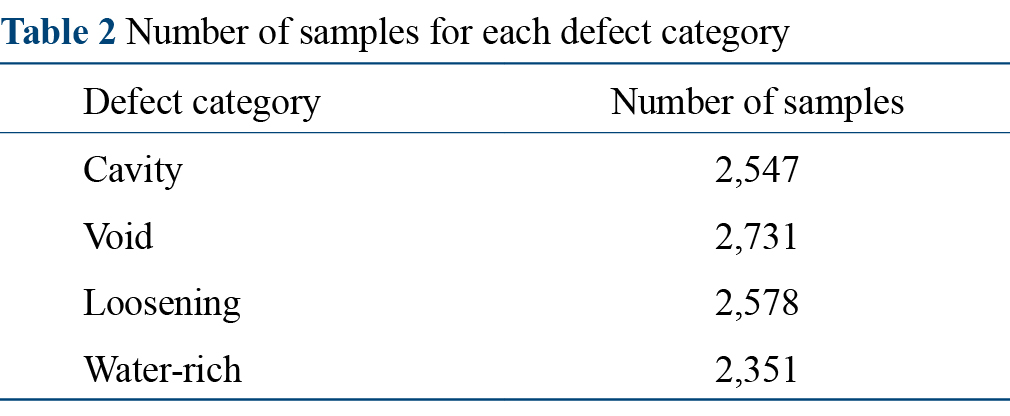
The three operations described above were applied to expand the empirical dataset. In accordance with GPR technical guidelines and defect manifestations in actual engineering scenarios, four defect categories—void, cavity, loosening, and water-rich—were annotated. We implemented a semi-automated annotation workflow using X-AnyLabeling software [14]. Initially, a manually annotated subset was used to pretrain a detection model, which generated candidate bounding boxes for unlabelled images; these candidates were subsequently corrected and verified by domain experts. This process yielded 3,274 accurately annotated images. The distribution of defect types is summarized in Table 2.
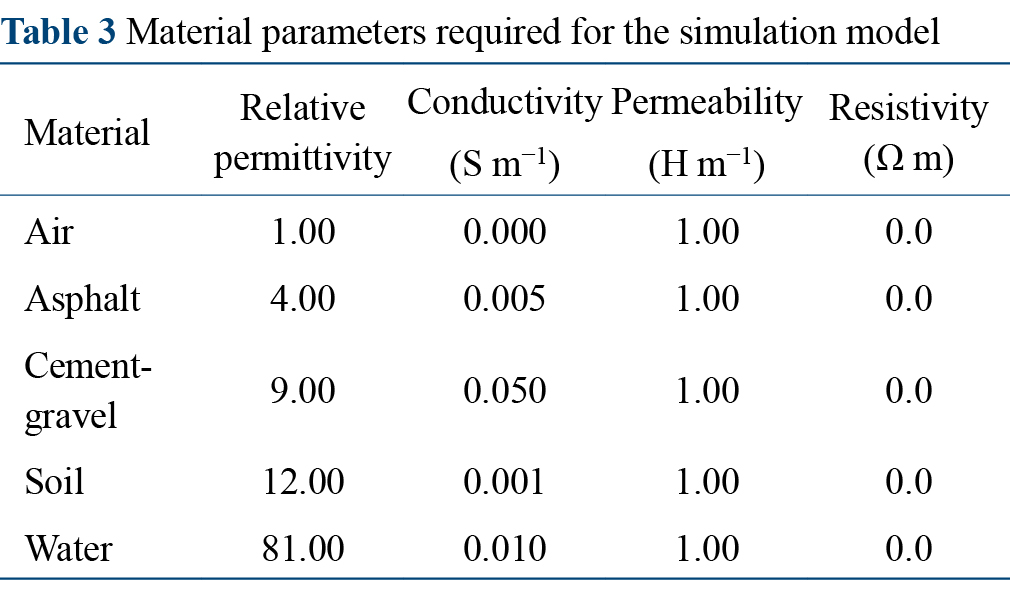
To ensure robust feature learning and compensate for the scarcity of water-rich defects in empirical datasets, gprMax simulations were generated comprising 200 instances each of void, cavity, and loosening defects, alongside 400 instances of water-rich defects. In accordance with the Technical Standard for Integrated Detection and Risk Assessment of Urban Subsurface Defects (JGJ/T 437-2018) [15], the road profile was modelled as a four-layers stratified structure—consisting of air, pavement, composite, and subgrade layers—with thicknesses of 0.05, 0.15, 0.35, and 1.00 m, respectively.
The specific material properties and corresponding electromagnetic parameters employed in the simulation model are summarized in Table 3.
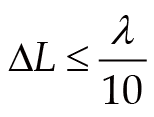
To mitigate numerical dispersion, the spatial resolution ∆L must be rigorously defined. According to established empirical criteria, ∆L must be no larger than one-tenth of the minimum wavelength of the propagating electromagnetic field, as shown in Eqaution (1). Adherence to this constraint ensures the accurate representation of high-frequency waveform components, thereby effectively minimizing numerical dispersion and enhancing simulation fidelity.(1)
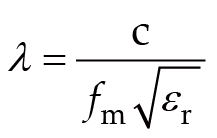
The minimum wavelength of the electromagnetic field is governed by the relative permittivity of the propagation medium and the signal frequency. To ensure a conservative estimate, the maximum frequency is defined as three times the central frequency, i.e., fm = 2,700 MHz. The corresponding minimum wavelength is calculated via Equation (2):(2)where, c denotes the speed of light (3 × 10⁸ m s-1), fm represents the maximum frequency, and εr is the relative permittivity.
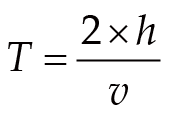
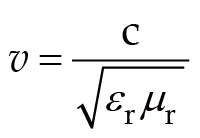
Based on the calculated minimum wavelength, the theoretical upper bound for the spatial resolution is defined. However, to rigorously suppress the numerical dispersion inherent in the Finite-Difference Time-Domain (FDTD) algorithm and minimize staircase approximation errors at curved material interfaces, we adopted a more stringent grid size of ∆L = 0.002 m. This high-resolution discretization is critical for capturing the high-frequency diffraction edges of early-stage voids and subtle cracks, ensuring that the simulated waveforms faithfully represent the complex geometric boundaries of real-world defects. The selection of the time window must account for the travel time of the electromagnetic wave from emission, through the medium, to the defect and back, as given by:(3)where, h denotes the model layer thickness (m) and v represents the wave velocity. v is calculated as follows:(4)where, μr is the relative permeability.
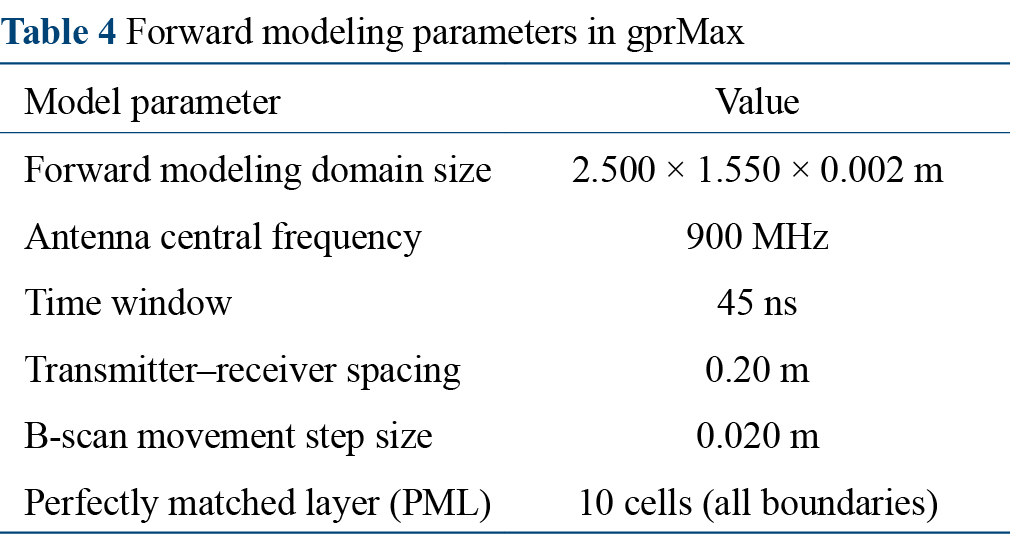
The theoretical time window required for a round-trip travel to the maximum depth is calculated as 36 ns using Equation (3). However, given the heterogeneous nature of subsurface media, we extended the simulation window to 45 ns. This expansion is physically justified by two key factors. First, Water-rich defects possess a high relative permittivity, which significantly retards the electromagnetic wave velocity, increasing the travel time. Second, irregular defect geometries (e.g., cavity) often induce multiple scattering and resonance, generating prolonged signal tails. The adopted 45 ns window provides a sufficient physical margin to capture these delayed scattering signatures fully, preventing signal truncation at the bottom of the B-scan image. The specific parameters for road defect simulations are listed in Table 4.
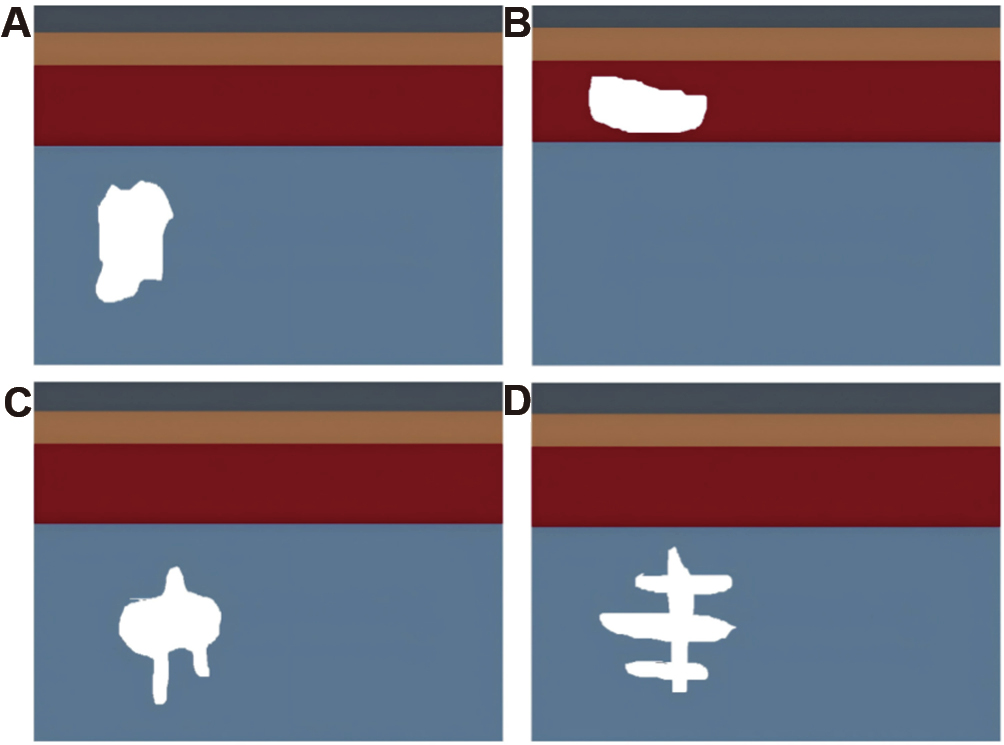
Forward simulations of four defect types—void, cavity, loosening, and water-rich—were conducted using gprMax. Void typically occur in the subgrade, with small horizontal and large vertical extent, filled with air. Cavity occurs at the interface of the composite and subgrade layers, forming elongated rectangular shapes, also filled with air. Loosening appears in the subgrade with large horizontal and vertical dimensions, represented by a new medium with a dielectric constant of 3.5. Water-rich defects, generally in the subgrade, exhibit high moisture content, low strength, and high porosity, filled with water. Simulations were configured according to the dielectric constants in Table 4. Schematic representations of the four defect types are shown in Figure 2.
To ensure the fidelity and reliability of the virtual dataset, a rigorous quality control protocol was implemented. First, the simulation parameters (dielectric constants and conductivity) were strictly calibrated against standard engineering guidelines to reflect realistic subsurface properties. Second, to bridge the domain gap between idealized simulations and noisy field data, we applied a noise injection strategy (Figure 1E) to the generated B-scans, simulating complex environmental interference. Finally, the synthetic images underwent a strict manual validation process to confirm that the morphological features (e.g., hyperbolic diffraction tails) were physically consistent with empirical observations, ensuring that the generated samples faithfully represent real-world defect characteristics.
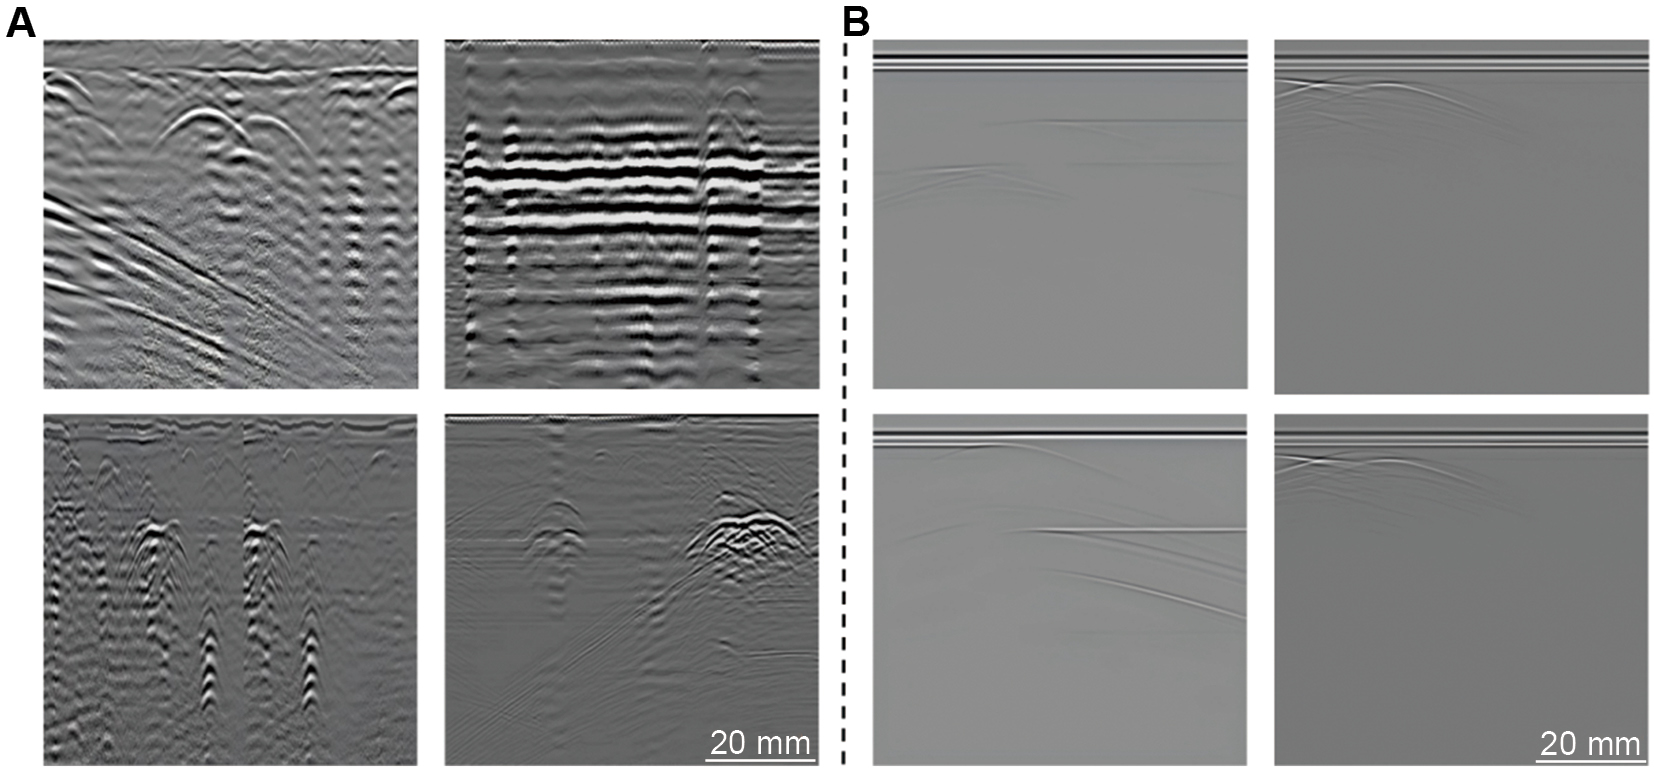
The empirical GS8000 dataset and the gprMax simulated data were combined and randomized to create the experimental subData dataset, ensuring a balanced representation across the four defect types and their diverse manifestations. To prevent insufficient feature learning for underrepresented defects, the dataset was re-annotated using the automated procedure and partitioned into training, validation, and test sets in a 7: 2: 1 ratio (2,992, 855, and 427 images, respectively), in accordance with standardized machine learning practices. Representative samples from the subData dataset are shown in Figure 3.
The YOLOv11 architecture represents a high-accuracy, efficient evolution of the YOLO series, offering significant improvements over its predecessor, YOLOv8 [16]. Its structural design comprises three primary components: the backbone, neck, and detection head. In both the backbone and neck, YOLOv11 replaces the original C2f modules of YOLOv8 with C3k2 modules, which employ dual convolutional kernels to achieve finer feature-map partitioning, thereby optimizing both representation quality and extraction speed [17]. Furthermore, a C2PSA refinement layer is integrated following the fast spatial pyramid pooling (SPPF) module. This layer combines multiple C2f modules with polarized self-attention to map features into a high-dimensional space, facilitating the capture of complex nonlinear relationships and enhancing overall feature representation.
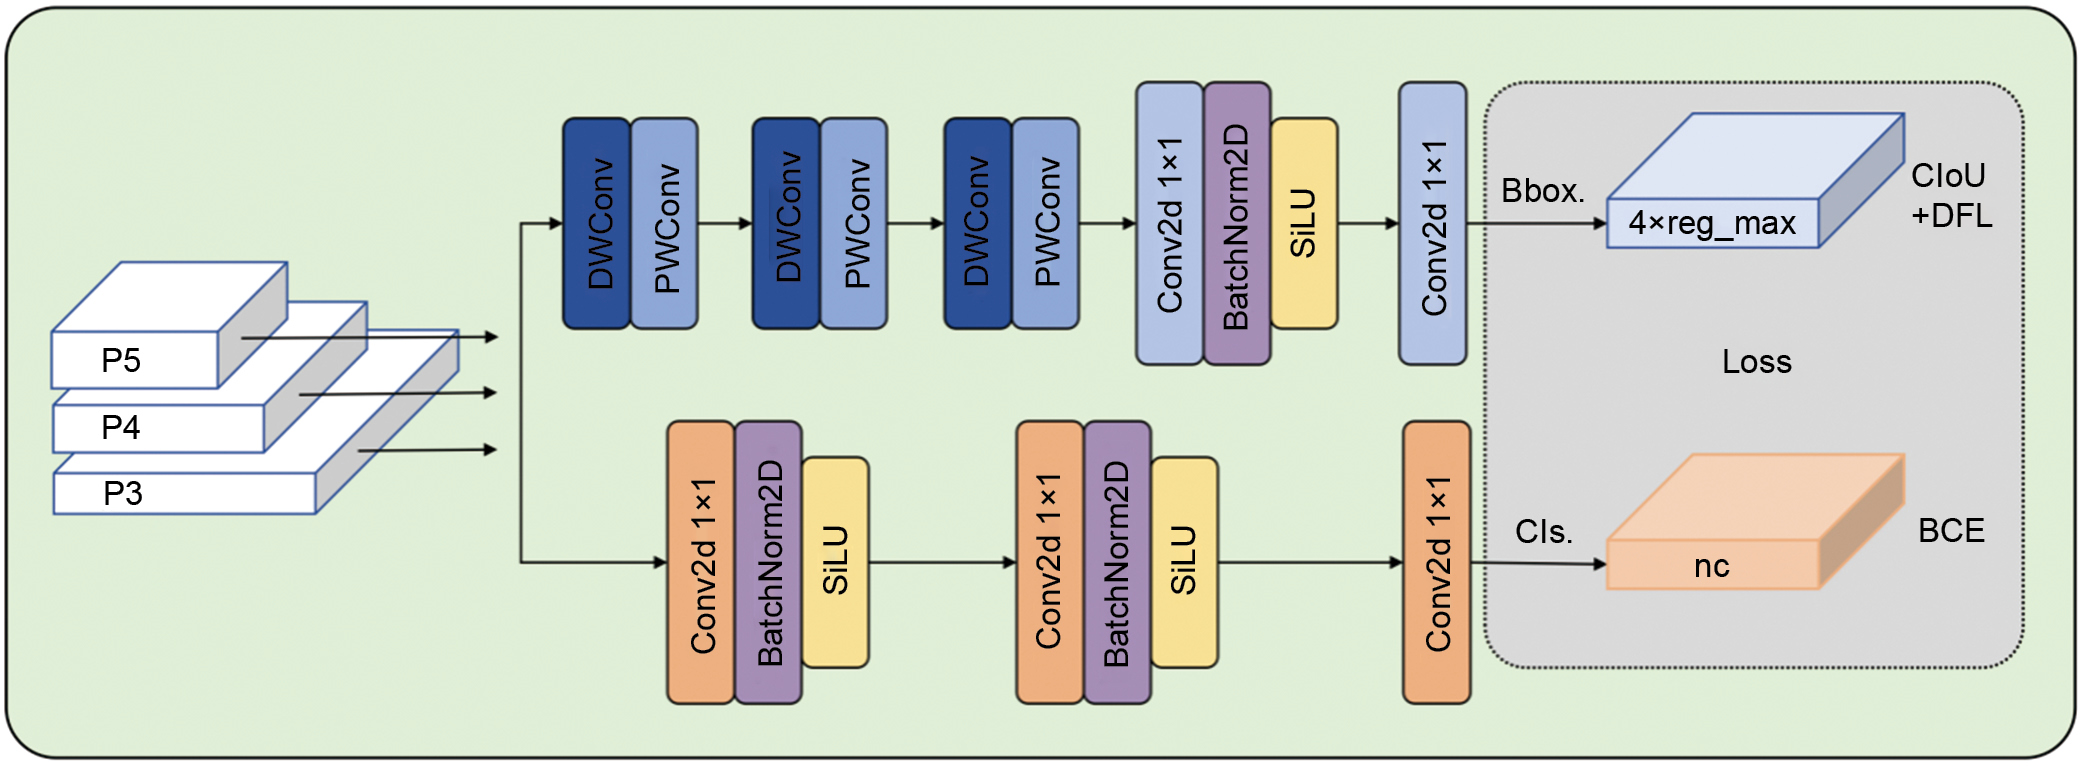
As illustrated in Figure 4, the proposed MARD-Net is built upon the YOLOv11n architecture and is specifically optimized for real-world subsurface road defect detection. It addresses critical challenges such as deployment on resource-constrained edge devices, low detection accuracy for visually similar defects, and the difficulty of extracting robust features from cluttered backgrounds. MARD-Net incorporates three key architectural innovations. (1) LADH: to mitigate the computational overhead and feature redundancy inherent in conventional YOLO detection heads, LADH decouples the regression and classification tasks via asymmetric branches. The regression branch stacks three depthwise separable convolutions (DSConv) to efficiently capture defect edges and fine spatial details, while the classification branch employs two standard convolutions to maintain global semantic consistency. This design optimizes the balance between computational complexity and detection accuracy, particularly enhancing robustness for small or irregularly shaped subsurface defects. (2) RepNCSPELAN-enhanced backbone: to accommodate the high variability in scale, texture, and morphology of subsurface defects, the backbone integrates the RepNCSPELAN4_CAA module. By leveraging re-parameterization and cross-stage fea-ture aggregation, this module overcomes the hierarchical limitations of conventional convolutions. RepNCSPELAN4_CAA partitions feature maps into parallel branches for independent refinement and subsequent fusion, thereby expanding the effective receptive field. This improves the modeling of complex subsurface structures, enabling the precise characterization of subtle cracks and Void. (3) MPCA: given that defect regions often occupy minimal portions of road images while background pixels dominate, standard feature extraction is prone to spatial blurring and class imbalance. MPCA addresses this by applying average pooling along global, horizontal, and vertical dimensions, combined with channel weighting and adaptive fusion to dynamically enhance multi-scale features. This mechanism selectively strengthens network responses to defect regions while suppressing redundant background noise, enabling precise attention and discrimination under complex pavement conditions.
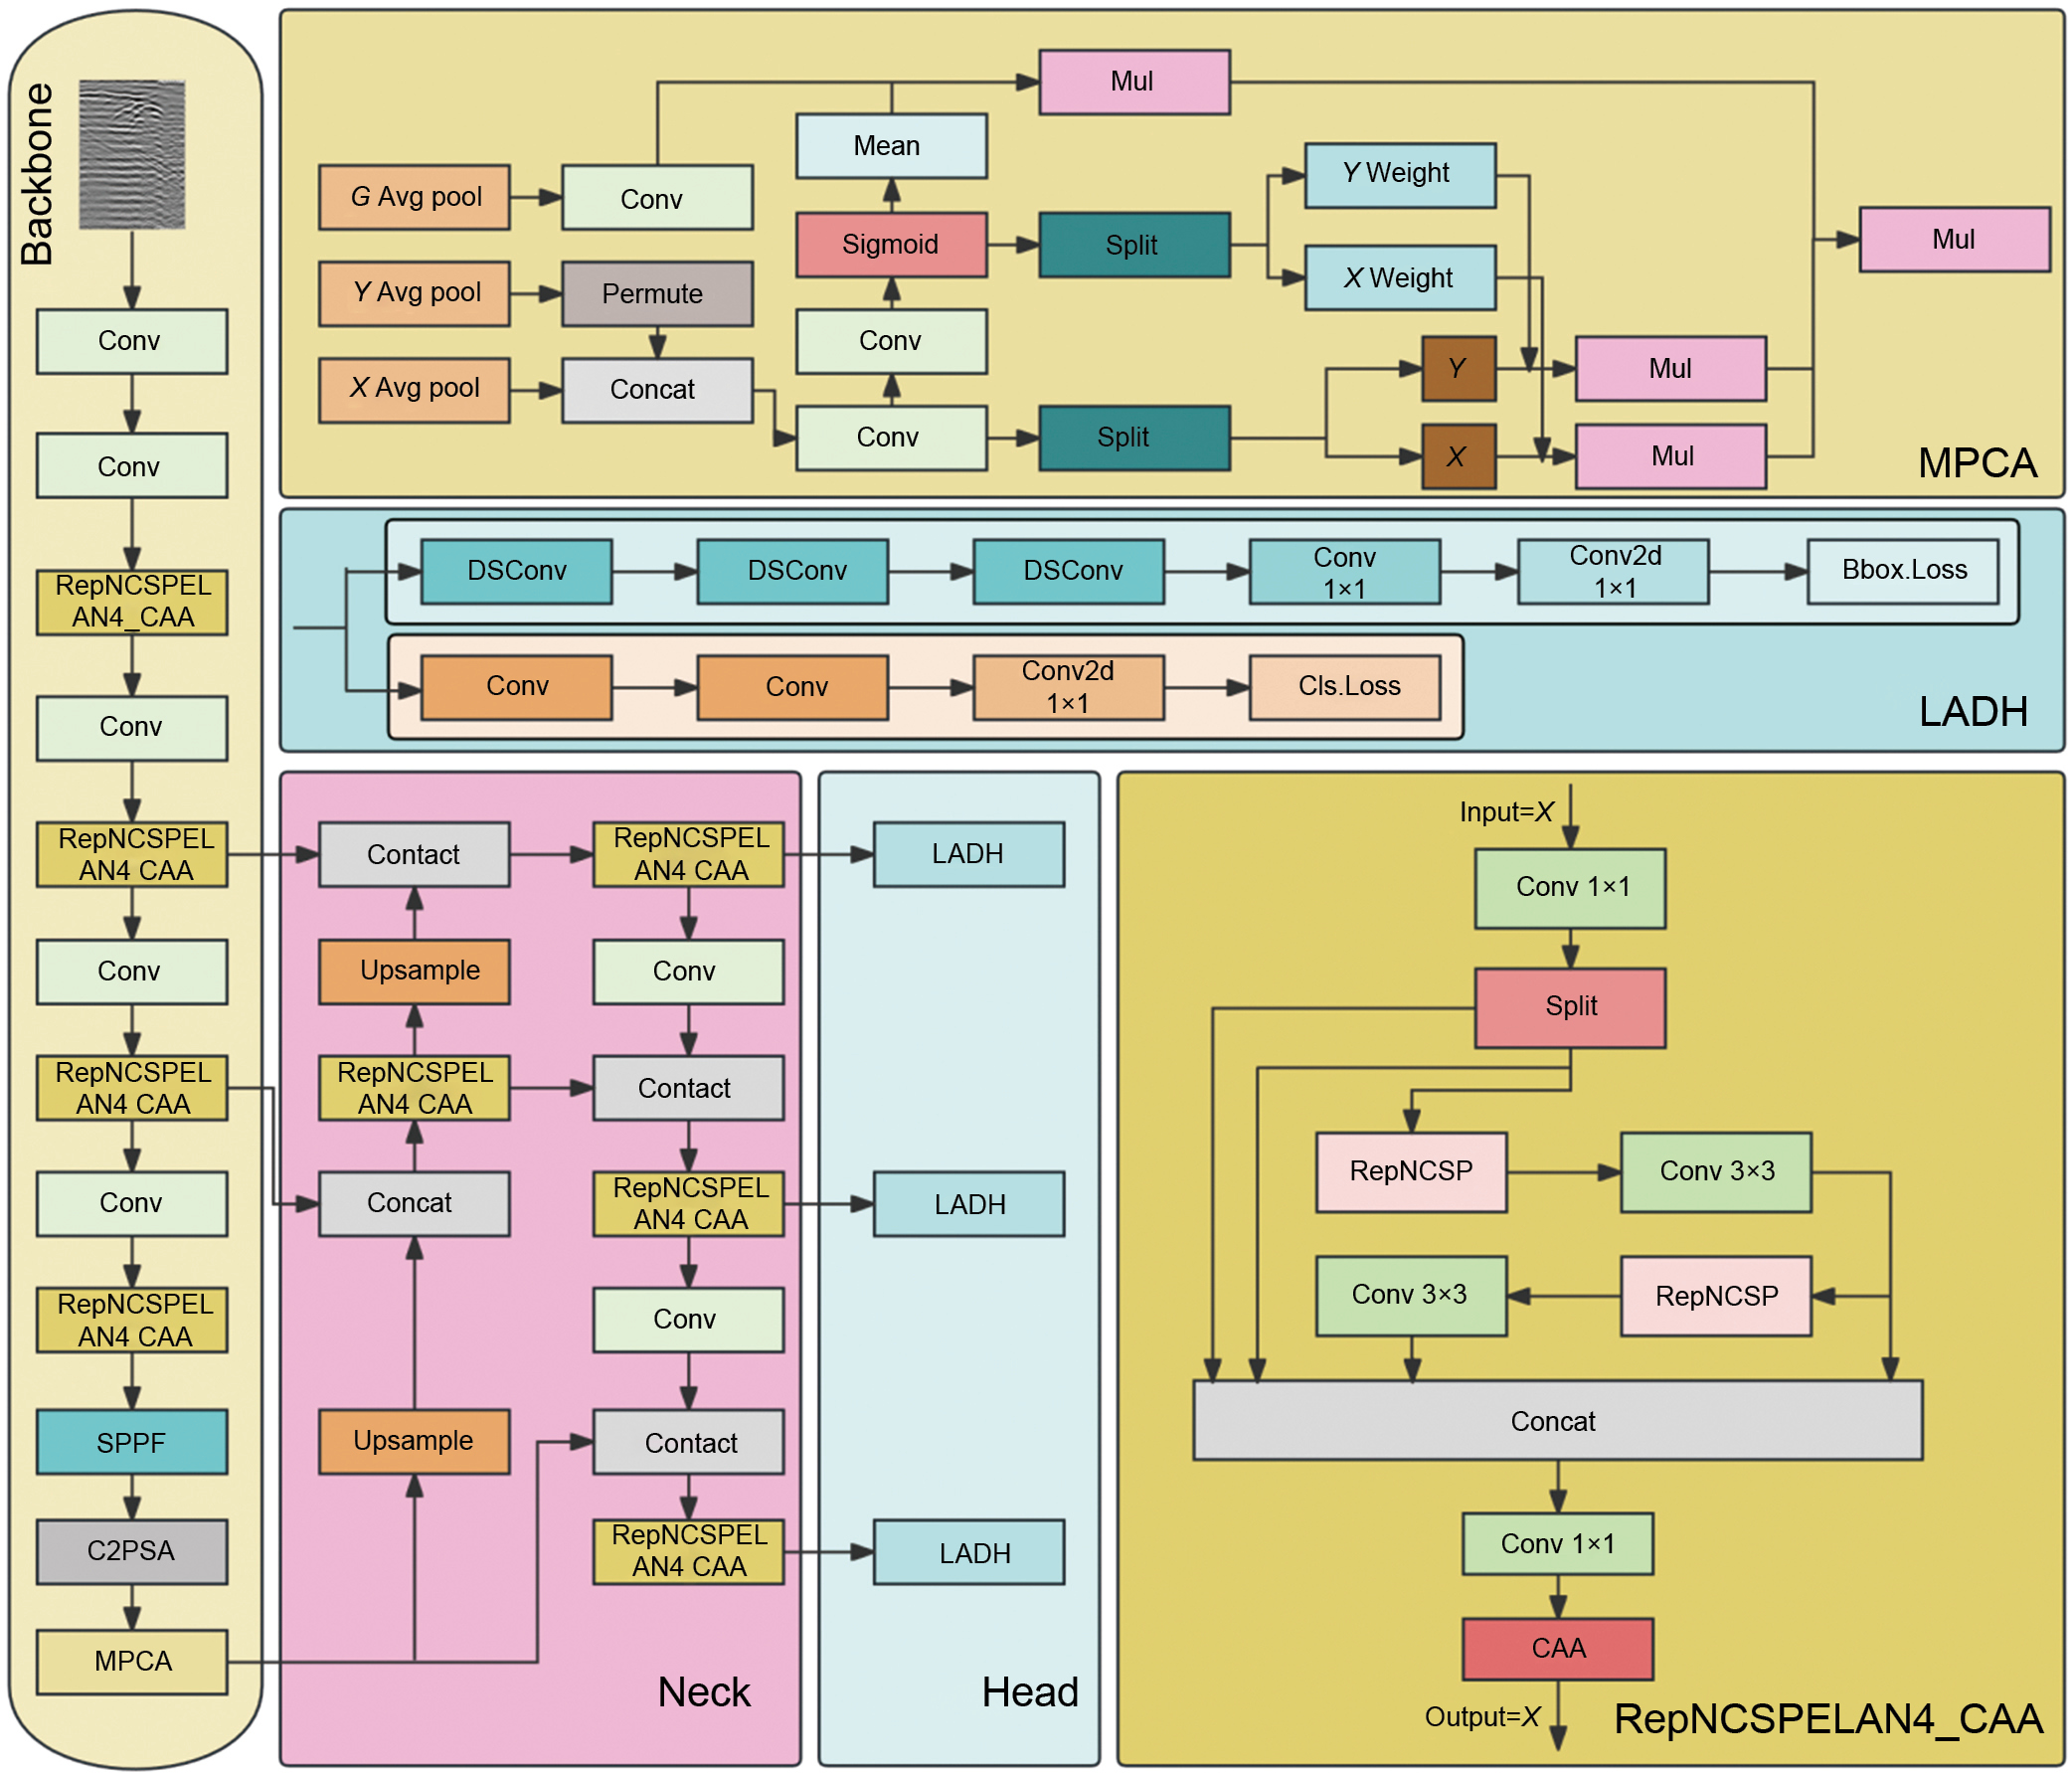
The MPCA module is designed to simultaneously capture global and local information from feature maps, thereby enhancing their representational capability [18]. To effectively embed positional information into channel attention, MPCA executes two operations: coordinate embedding and coordinate attention generation.
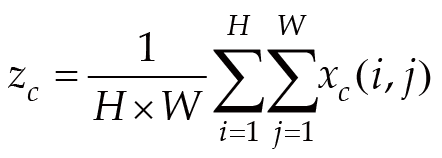
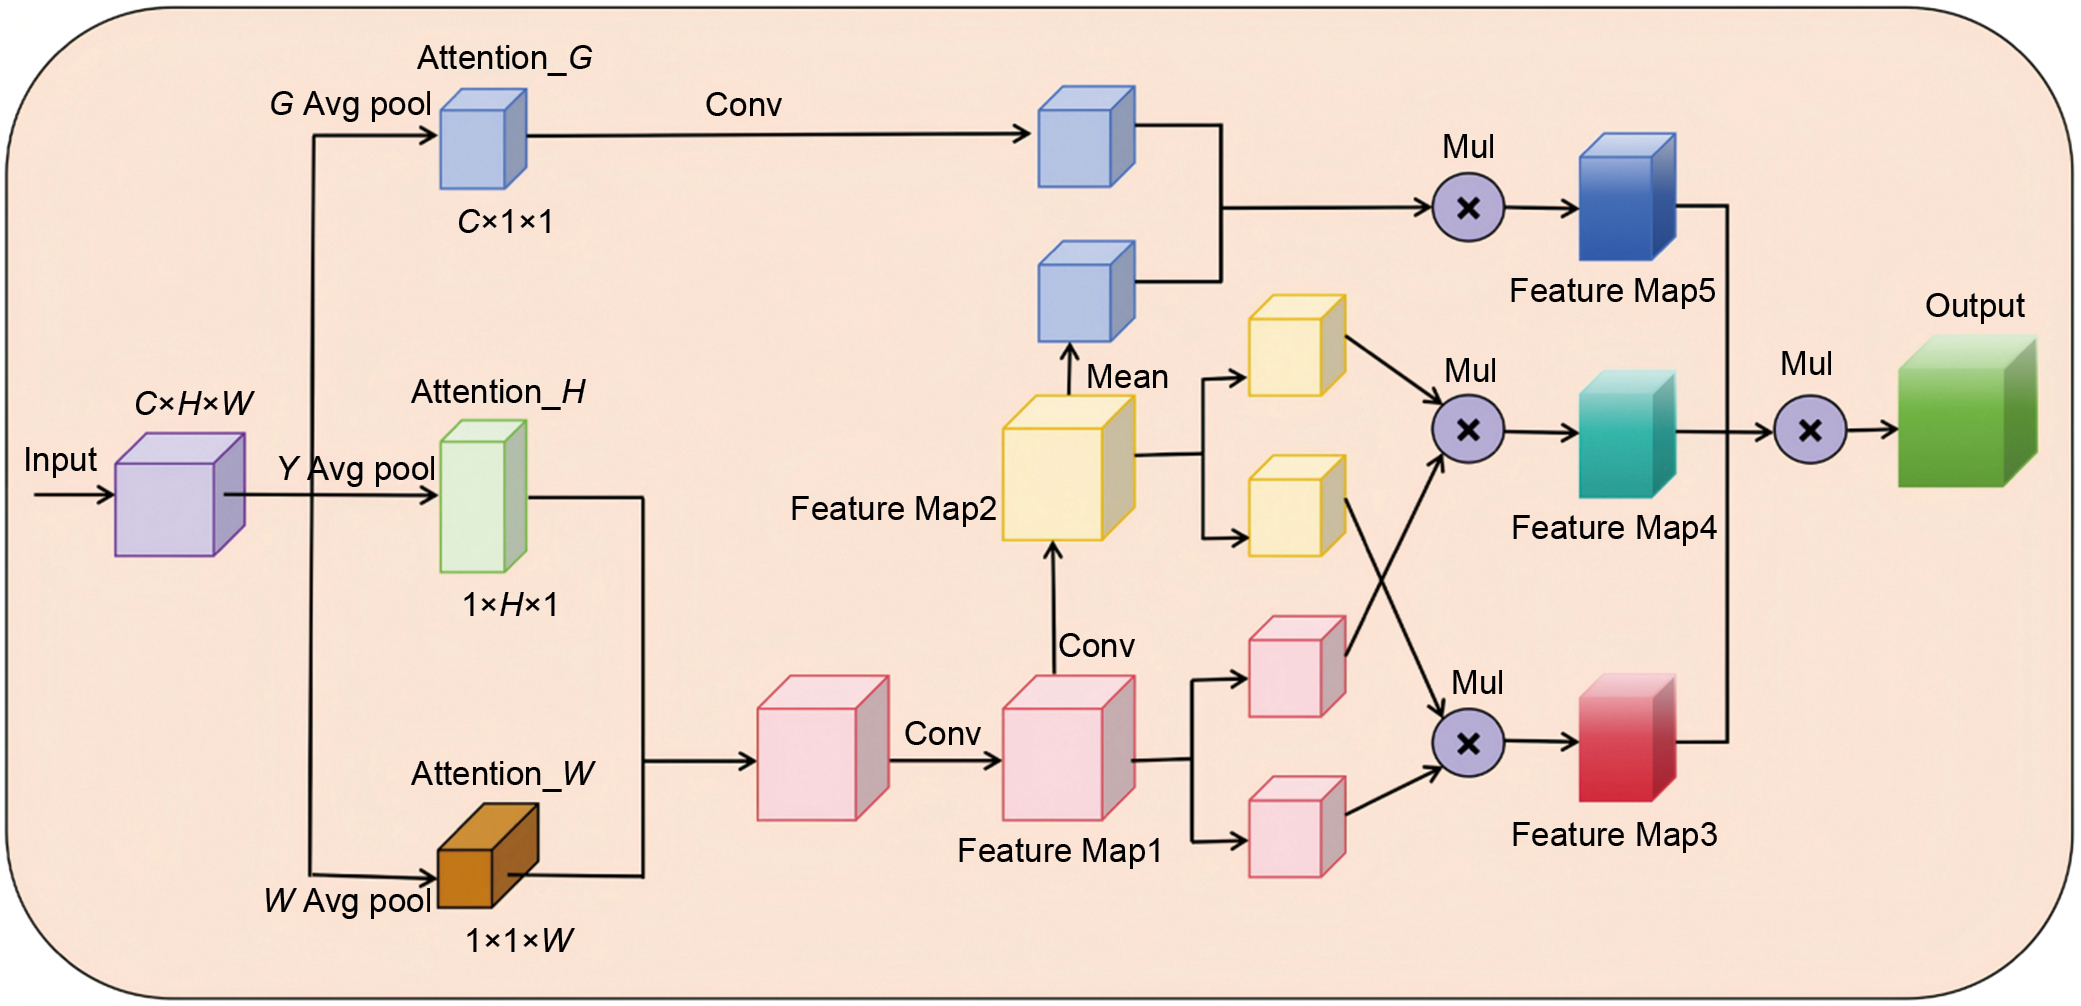
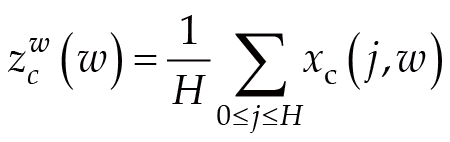
As illustrated in Figure 5, coordinate information is embedded within the MPCA module via horizontal and vertical average pooling, which facilitates the capture of precise positional cues. Simultaneously, global average pooling compresses spatial information into channel descriptors, to preserve global feature context. The MPCA module transforms the global average pooling result into zc:(5)where xc(i, j) represents the input feature map at channel c, and H and W denote the height and width of the feature map, respectively.
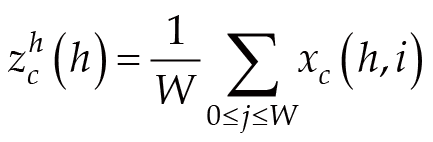
A one-to-one feature encoding scheme is established. Given input xc(i, j), pooling kernels of size 1 × W and H × 1 are employed to encode each channel along horizontal and vertical coordinates, respectively. By applying these pooling operations, the output for channel c at height h is expressed as:(6)
Similarly, the output of channel c with width W is expressed as:(7)The three pooling operations correspond to Figure 5: horizontal average pooling(Xavg), vertical average pooling(Yavg), and global average pooling(Pavg). Xavg and Yavg pooling operations aggregate features along the spatial dimensions, yielding two feature maps with distinct awareness. Meanwhile, Pavg extracts global statistics for each channel. Together, these operations preserve precise positional information while capturing global features, enabling the network to localize targets more accurately.
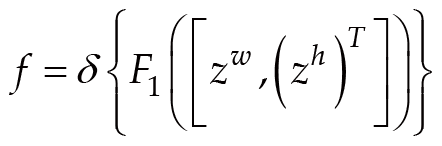
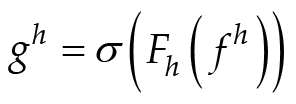
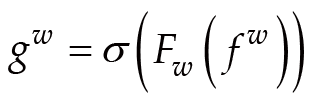
First, the vertically embedded features are transposed to align with the horizontal embeddings along the feature dimension. The transposed vertical and horizontal embeddings are then concatenated to form a unified representation, which is processed by a 3 × 1 convolution function F1, to separately extract horizontal and vertical feature information X and Y, expressed as:(8)where, [∙,∙] denotes concatenation along the spatial dimension, δ is the nonlinear activation function, and represents the intermediate feature map encoding horizontal and vertical spatial information, where r is the reduction ratio controlling block size. Subsequently, f is split along the spatial dimension into two independent tensors, and . Two separate 1 × 1 convolutions, Fh and Fw, are then applied to map fh and fw to tensors with the same channel dimension as the input feature map, expressed as:(9)(10)where, σ denotes the sigmoid function. Finally, the outputs gh and gw are expanded and applied as attention weights. The output of the coordinate attention module is thus expressed as:(11)
Equation (11) mathematically defines the re-weighting mechanism. By encoding spatial coordinate information into channel weights ( and ), MPCA explicitly models the long-range dependencies of underground structures. This multiplicative integration ensures that the network suppresses high-frequency clutter inherent in complex geological backgrounds while selectively amplifying the weak reflection signatures of defects. Consequently, the output feature map yc retains precise positional cues, enabling subsequent layers to focus on structurally significant regions rather than background noise.
Given the complexity of subsurface road environments and the high computational demands of real-time processing, a LADH was developed to facilitate edge deployment. Empirical experiments demonstrate that LADH not only improves defect detection accuracy but also significantly reduces computational cost [19]. As illustrated in Figure 6, the architecture employs an asymmetric design: the regression branch replaces two standard 3 × 3 convolutions with three consecutive depthwise separable convolutions followed by an intermediate 1 × 1 standard convolution; conversely, the classification branch substitutes two depthwise separable convolutions with two 1 × 1 standard convolutions to streamline feature integration.
The regression branch employs a stack of three consecutive DSConv layers, effectively enhancing local feature modeling. This design expands the original 3 × 3 receptive field to 7 × 7, thereby improving fine-grained feature representation and enabling precise localization of large-scale defects such as water-rich and void. As illustrated, each DSConv unit consists of a depthwise convolution (DWConv) followed by a pointwise convolution (PWConv). To accurately reflect the sequential nature of this operation, the mathematical formulation is defined as:(12)where, Fin and Fout denote the input and output feature maps, respectively; DWConv represents depthwise convolution, and PWConv denotes pointwise convolution.
Equation (12) formalizes the core operation of the regression branch. By stacking three consecutive DSConv layers, the effective receptive field (ERF) is mathematically expanded from 3 × 3 to 7 × 7. This expansion is critical for the physical interpretation of GPR B-scans. Subsurface defects like void manifest as hyperbolic diffraction curves with extended tails. The expanded 7 × 7 receptive field enables the LADH to cover these complete geometric signatures in a single forward pass, preventing the misinterpretation of partial hyperbolic arcs as noise, which frequently occurs with standard limited-view kernels.
Stacking multiple DSConv layers enhances the model's nonlinear representation and spatial feature extraction at a relatively low computational cost. To further improve cross-channel interaction, a 1 × 1 standard convolution is integrated after the DSConv cascade, effectively aggregating channel information and suppressing background noise.
The rationale behind extending the receptive field to 7 × 7 via stacked DSConvs is deeply rooted in the physical propagation characteristics of GPR signals. Unlike optical images where objects possess explicit shapes, discrete underground defects (e.g., void) manifest as distinctive hyperbolic diffraction patterns in B-scan images due to the wide-beam nature of electromagnetic waves. A standard 3 × 3 kernel is often insufficient to encompass the spatial span of these hyperbolas, potentially leading to the misinterpretation of partial arcs as noise. By expanding the receptive field to 7 × 7, the regression branch can capture the complete geometric structure of the diffraction signature—encompassing both the apex and the extending tails. This holistic spatial modeling is critical for accurately regressing the bounding box coordinates of the physical defect source, rather than merely detecting localized signal anomalies.
In the original YOLOv11n detection head, the classification branch employs two cascaded DSConv layers. Although this design reduces computational complexity, it limits feature aggregation, potentially weakening high-level semantic representation. To address this, the classification subnetwork was redesigned by replacing the DSConv layers with two consecutive 1 × 1 standard convolutions. This modification preserves computational efficiency while enhancing inter-channel interactions, ensuring robust semantic representation without additional overhead.
The RepNCSPELAN4 module constitutes a core innovation of this study, integrating re-parameterization with cross-scale feature aggregation via a multi-path cooperative mechanism to facilitate efficient feature extraction and fusion. As illustrated in Figure 7, the input channels are initially expanded via a 1 × 1 convolution and subsequently partitioned into two distinct processing paths. The primary path employs re-parameterized Cross-Stage Partial networks (RepNCSP). During training, these networks enhance feature representation through multi-branch convolutions; during inference, they are structurally re-parameterized into a single-path architecture, thereby maintaining high accuracy while minimizing computational latency. The secondary path cascades RepNCSP submodules to refine multi-level features, progressively augmenting local details retention through channel compression, re-parameterized bottlenecks, and residual connections. Shallow and deep features are densely concatenated along the channel dimension, and the resulting output is compressed via a 1 × 1 convolution. This process yields a multi-scale feature map that synthesizes rich spatial details with robust semantic representations. By leveraging re-parameterization and dynamic channel splitting, the module optimizes the balance between efficiency and feature diversity. This design effectively captures multi-scale spatial relationships amidst complex geological clutter, establishing a robust foundation for real-time, high-precision detection.
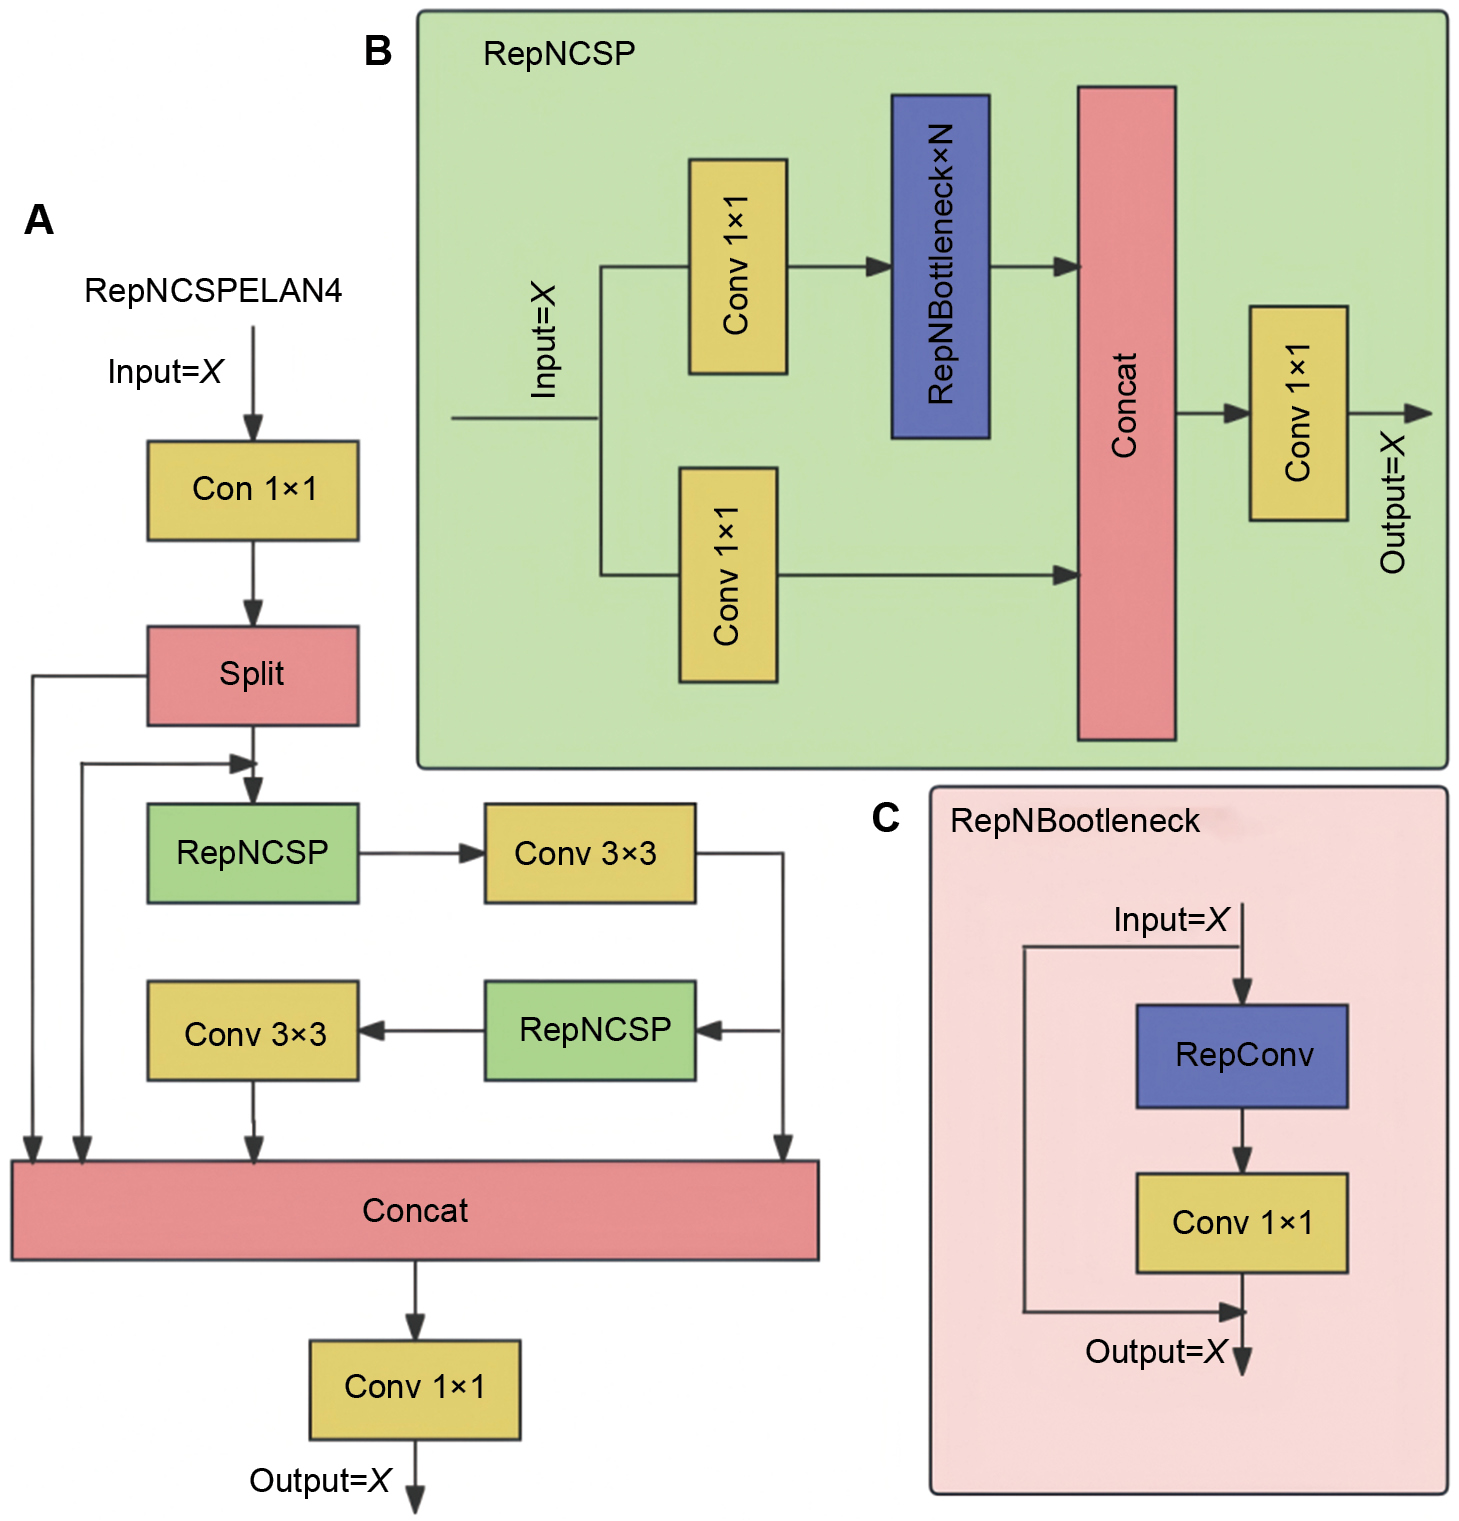
The RepNCSPELAN4 module integrates re-parameterization, cross-stage channel optimization, and multi-scale feature aggregation to achieve an optimal balance between processing speed, detection accuracy, and architectural lightness for subsurface road defect detection. During the training phase, multi-branch convolutions are employed to enrich feature representation; conversely, during inference, these branches are structurally re-parameterized into a single-path architecture. This mechanism yields significant performance gains with minimal computational overhead. A cross-stage channel splitting strategy partitions input features into two distinct paths: a primary path that deepens feature abstraction via stacked re-parameterized bottlenecks, and a lightweight secondary path that preserves raw feature information. This dual-path design effectively mitigates gradient redundancy and reduces computational load, rendering the module highly suitable for edge deployment.
Furthermore, an ELAN-style multi-scale dense feature concatenation strategy fuses shallow detail with deep semantic information, enhancing discrimination for small defects, dense defect clusters, and targets within complex geological backgrounds. This design maintains a lightweight structure while effectively addressing conventional limitations—such as the prevalence of false negatives and false positives in multi-scale target detection—providing a robust framework for efficient, high-resolution detection. To further augment this structure, we incorporate the context anchor attention (CAA) module, originally proposed by Cai et al. [20] and illustrated in Figure 8.
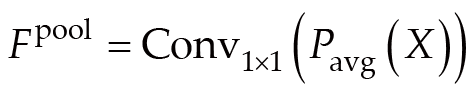
The CAA module models context via multi-stage collaborative processing. Input features X are first compressed through global average pooling (Pavg), followed by a 1 × 1 convolution adjusts channel dimensions to produce the initial global context representation Fpool. This provides a semantic basis for subsequent long-range modeling, as expressed in Equation (13) [20].(13)
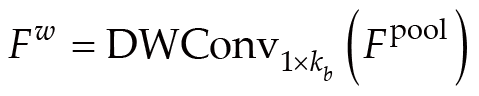
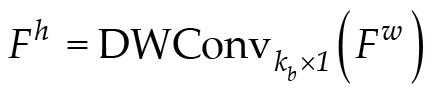
Subsequently, depthwise separable one-dimensional strip convolutions are applied along the horizontal (1 × kb) and vertical (kb × 1) axes to model spatial dependencies across width and height, respectively. The kernel size is dynamically set as kb = 11 + 2n (where n denotes network depth), allowing the receptive field to expand linearly while better accommodating elongated target structures, as described in Equations (14) and (15) [20].(14)(15)
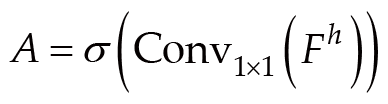
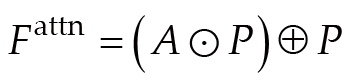
Finally, the direction-sensitive feature Fh is mapped into a spatial attention map A. A lightweight convolution followed by a sigmoid activation generates spatial attention weights, which are dynamically fused with local features P. A residual connection is then applied to enhance responses in target regions, yielding the output enhanced feature Fattn, as defined in Equations (16) and (17)[20]:(16)where σ denotes the sigmoid function.(17)
The fusion strategy defined in Equation (17) represents a residual attention mechanism, where "" denotes element-wise multiplication, and "⊕" denotes element-wise addition. The term AP injects global contextual guidance (captured by the large-kernel strip convolutions) into the local features, while the term ⊕P preserves the original high-resolution spatial details. This design ensures robustness against scale variation, allowing the network to simultaneously model extensive defects (e.g., water-rich) via global context and small anomalies (e.g., cavity) via local features. This dynamic balance between semantic abstraction and textural preservation is critical for multi-scale detection.
By decomposing large-kernel convolutions into lightweight one-dimensional operations, this process captures cross-region dependencies of elongated subsurface defects while reducing computational cost. It also suppresses background noise, balancing local detail preservation with global semantic representation.
The CAA module is integrated between the multi-scale feature concatenation stage and the final convolution within the RepNCSPELAN4 module. This integration employs a dynamic context anchoring strategy to enhance semantic awareness during feature fusion, forming the RepNCSPELAN4_CAA module within the YOLOv11n architecture. The design preserves the inherent advantages of re-parameterization and cross-stage channel optimization while explicitly addressing extreme target-scale variations and complex background interference in underground scenarios. The CAA module's 1D strip convolutions adaptively capture long-range dependencies, while its spatial attention mechanism softly filters the concatenated multi-scale features, enhancing target-region responses and suppressing background clutter. This approach is particularly effective for extensive defects such as voids and loosened zones, providing efficient feature enhancement for complex detection scenarios.
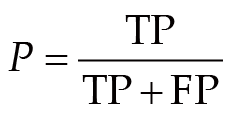
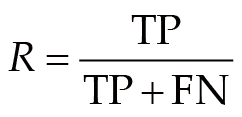
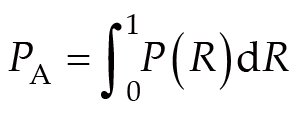
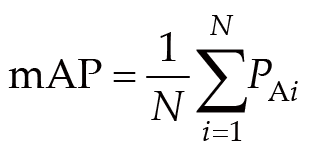
To validate the performance of the proposed method, we employ precision (P), recall (R), F1-score, mean Average Precision (mAP), floating point operations (FLOPs), and parameter count (Params) as evaluation metrics. Precision measures the proportion of true positives among all positive predictions, reflecting the reliability of the model's detections. Recall quantifies the proportion of actual positive instances correctly identified, indicating the model's coverage capability. mAP, a standard benchmark in object detection, represents the mean of the Average Precision (AP) calculated across all defect classes. Furthermore, FLOPs and Params serve as indicators of computational complexity and model size, respectively. Lower values for these metrics denote reduced resource consumption, which is critical for facilitating deployment on resource-constrained edge devices. The corresponding mathematical formulations are provided below:(18)(19)(20)(21)In Equations (18)–(21), TP denotes the number of true positives (correctly identified targets); FP represents false positives (negative samples misclassified as positive); FN indicates false negatives (positive samples misclassified as negative); N is the total number of classes; PAi denotes the AP for class i, and mAP represents the mean of the average precision values calculated across all classes.
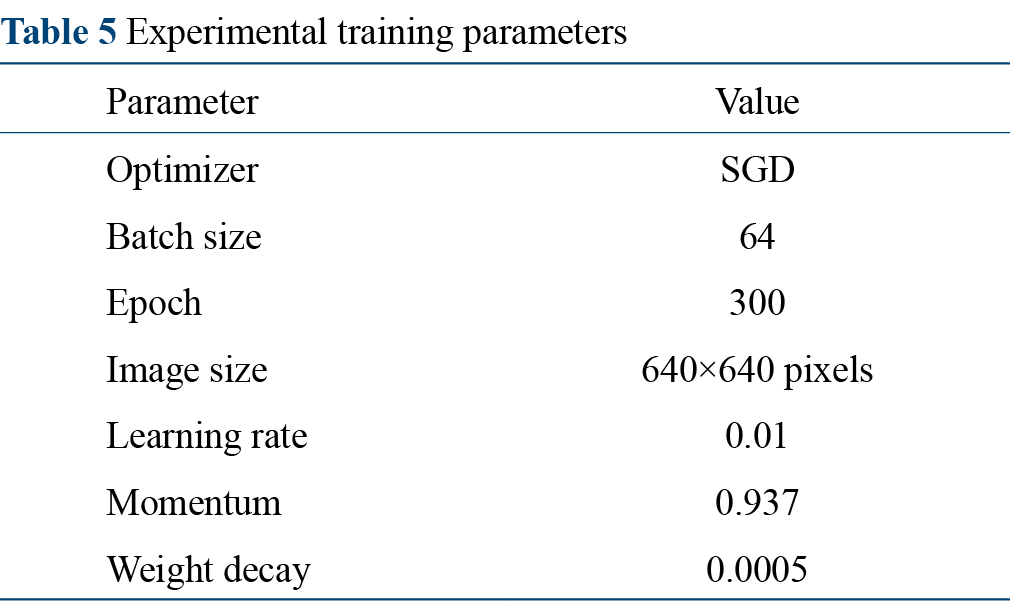
All deep learning experiments were conducted on a server running the Ubuntu operating system, configured with Python 3.10.14, PyTorch 2.0.1, and CUDA 12.1. The hardware infrastructure comprised an Xeon Gold 6133 CPU with 128 GiB RAM and an NVIDIA GeForce RTX 4090 GPU with 24 GiB VRAM. Key hyperparameters are listed in Table 5. Input images were resized to 640 × 640 pixels via bilinear interpolation, and the batch size was set to 64. The model was trained for 300 epochs using stochastic gradient descent (SGD) with an initial learning rate of 0.01 and a momentum of 0.9. To stabilize early training, a 1,000-iteration warm-up phase was implemented, during which the bias learning rate was gradually increased from 0.1 and momentum from 0.8 to 0.9. A weight decay of 0.0001 was applied throughout to prevent overfitting. An early stopping mechanism was employed, halting training if no performance improvement was observed over 15 consecutive epochs, thereby preserving optimal generalization. The loss function used is defined as follows:(22)where Lbox denotes the bounding box regression loss, Lcls represents the classification loss, and Ldfl corresponds to the distribution focal loss. The constants λbox, λcls and λdfl were set to 7.5, 0.5, and 1.5, respectively.
To ensure a strictly fair comparison, all benchmark models were retrained using the "subData" dataset constructed in this study. All models adhered to an identical data partitioning scheme (7 : 2 : 1 for training, validation, and testing) and were executed under uniform hardware configurations.
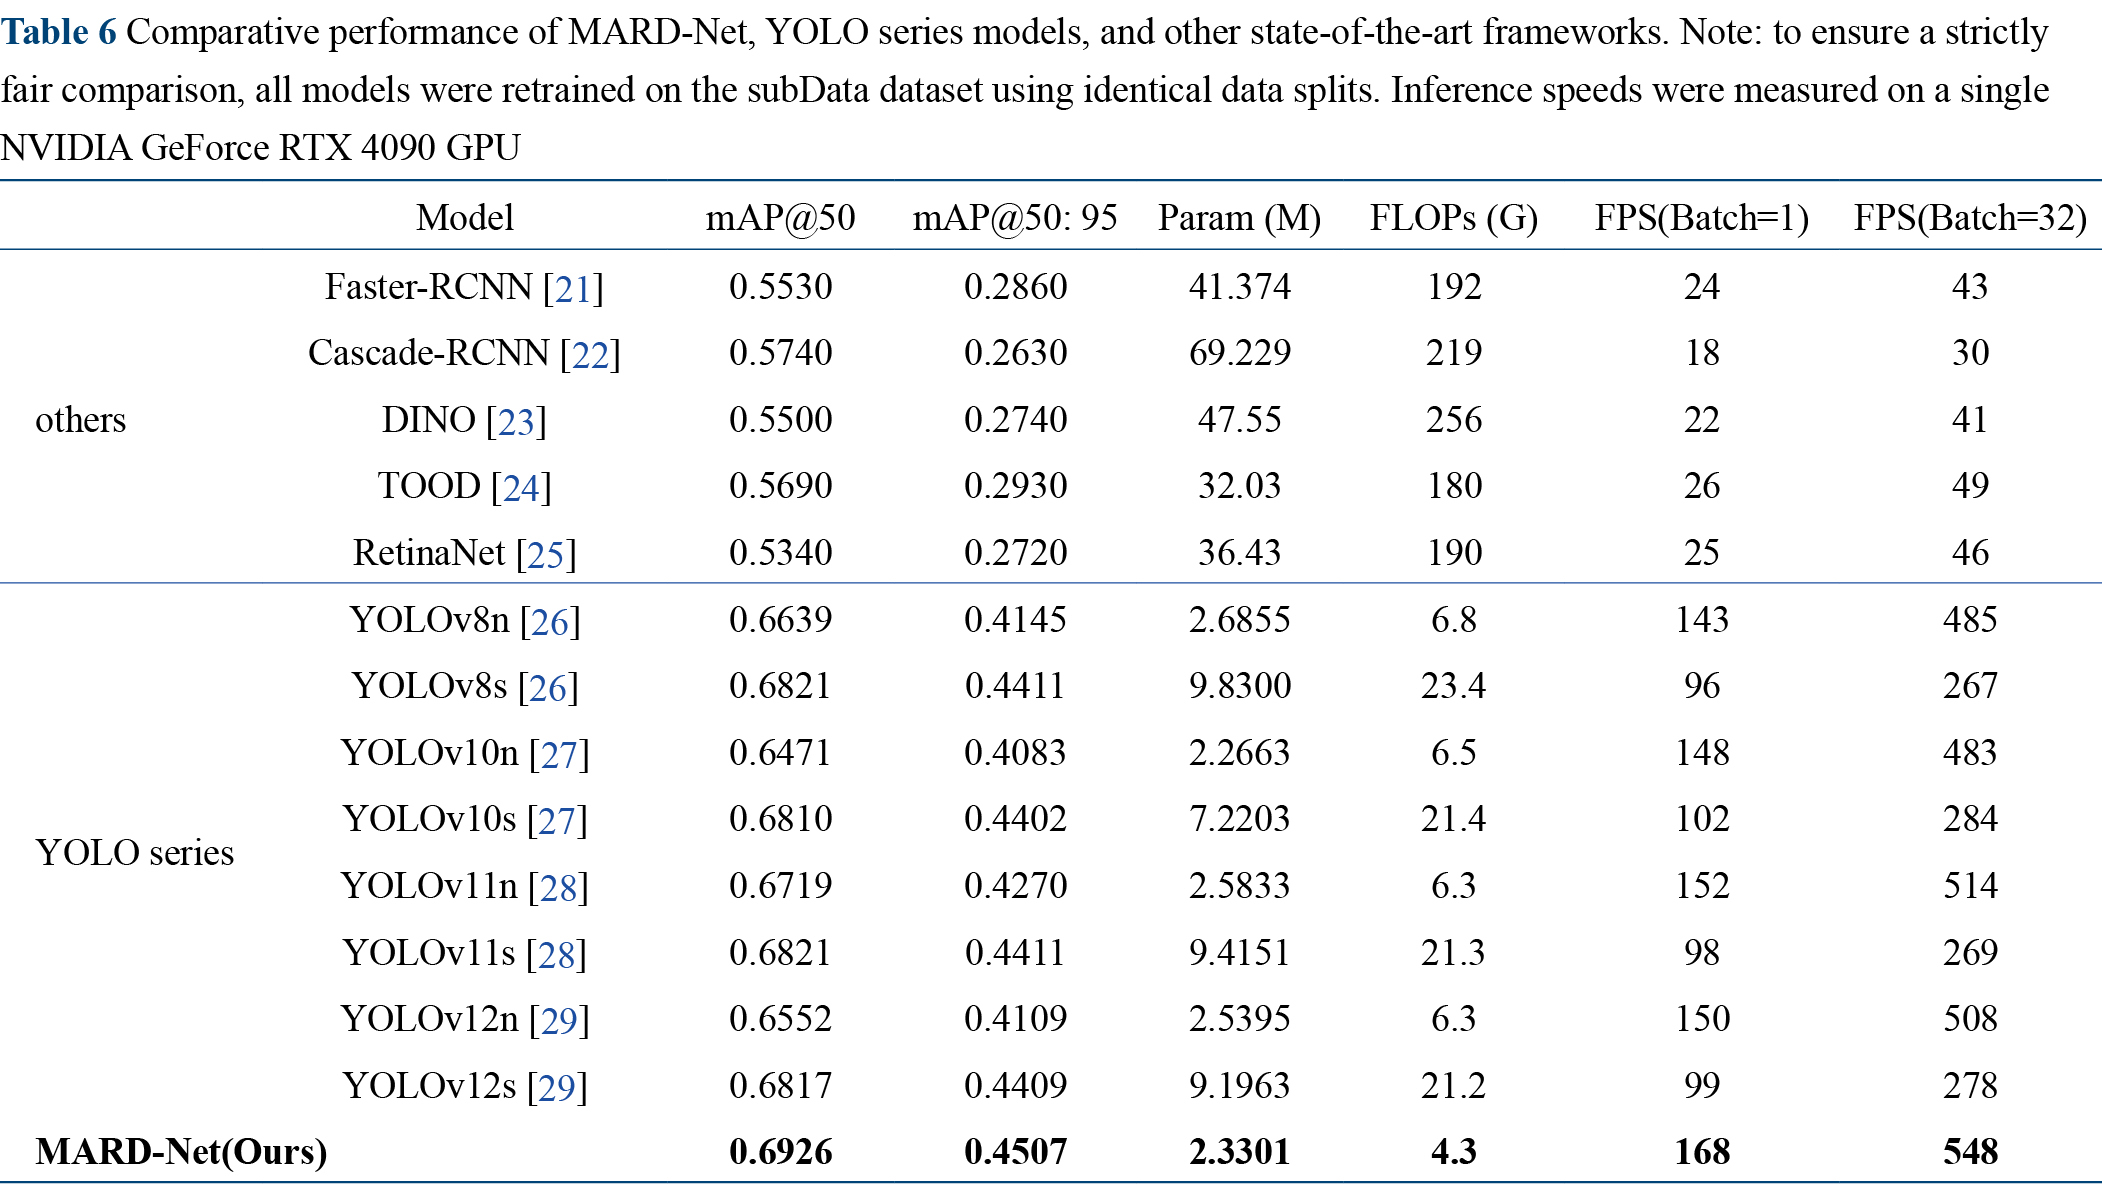
As detailed in Table 6, two-stage detectors such as Faster R-CNN [21] and Cascade-RCNN [22] achieved mAP@50 of 0.553 and 0.574, respectively. However, their substantial computational costs preclude real-time deployment for road defect detection. Similarly, alternative single-stage detectors—DINO [23], TOOD [24], and RetinaNet [25]—yielded lower mAP@50 compared to YOLO variants while exhibiting excessive parameter counts and reduced computational efficiency, rendering them unsuitable for lightweight applications. Within the YOLO family, models such as YOLOv8s [26], YOLOv10s [27], YOLOv11n [28], YOLOv11s [28], and YOLOv12s [29] demonstrated competitive mAP@50 performance. Nevertheless, the larger variants (YOLOv8s, YOLOv10s, and YOLOv11s) incurred high computational penalties, limiting their utility for rapid on-site detection. Our comparative analysis reveals distinct trade-offs inherent in existing architectures. Two-stage detectors like Faster R-CNN [21], while structurally robust, suffer from excessive computational redundancy in region proposal generation, leading to low inference speeds (< 45 frames per second (FPS)) unsuitable for real-time GPR scanning. Conversely, advanced transformer-based models like DINO [23], despite their global receptive fields, introduce high parameter overheads (Params >100M), complicating edge deployment. Among the YOLO series, although YOLOv8s [26] and YOLOv12s [29] achieve competitive accuracy, they struggle to balance fine-grained localization with computational cost. MARD-Net addresses these specific limitations: the LADH module significantly reduces the regression burden via asymmetric branches, while MPCA effectively suppresses the high-frequency clutter that confuses standard CNN backbones. Consequently, MARD-Net achieves the highest mAP@50 (0.6926) among all compared models, outperforming both the baseline YOLOv11n and the advanced YOLOv12s. Furthermore, it reduces the parameter count by approximately 0.25 M compared to YOLOv11n. Crucially, regarding empirical inference speed on an NVIDIA RTX 4090, MARD-Net attains 168 FPS (Batch = 1) and 548 FPS (Batch = 32), surpassing the baseline YOLOv11n (152 FPS) and significantly outperforming the heavier YOLOv12s (99 FPS). MARD-Net thus offers an optimal equilibrium between detection accuracy and computational efficiency, validating its suitability for high-precision, lightweight underground defect detection in resource-constrained environments.
| Model | mAP@50 | mAP@50: 95 | Param (M) | FLOPs (G) | FPS(Batch=1) | FPS(Batch=32) | |
|---|---|---|---|---|---|---|---|
| others | Faster-RCNN [21] | 0.5530 | 0.2860 | 41.374 | 192 | 24 | 43 |
| Cascade-RCNN [22] | 0.5740 | 0.2630 | 69.229 | 219 | 18 | 30 | |
| DINO [23] | 0.5500 | 0.2740 | 47.55 | 256 | 22 | 41 | |
| TOOD [24] | 0.5690 | 0.2930 | 32.03 | 180 | 26 | 49 | |
| RetinaNet [25] | 0.5340 | 0.2720 | 36.43 | 190 | 25 | 46 | |
| YOLO series | YOLOv8n [26] | 0.6639 | 0.4145 | 2.6855 | 6.8 | 143 | 485 |
| YOLOv8s [26] | 0.6821 | 0.4411 | 9.8300 | 23.4 | 96 | 267 | |
| YOLOv10n [27] | 0.6471 | 0.4083 | 2.2663 | 6.5 | 148 | 483 | |
| YOLOv10s [27] | 0.6810 | 0.4402 | 7.2203 | 21.4 | 102 | 284 | |
| YOLOv11n [28] | 0.6719 | 0.4270 | 2.5833 | 6.3 | 152 | 514 | |
| YOLOv11s [28] | 0.6821 | 0.4411 | 9.4151 | 21.3 | 98 | 269 | |
| YOLOv12n [29] | 0.6552 | 0.4109 | 2.5395 | 6.3 | 150 | 508 | |
| YOLOv12s [29] | 0.6817 | 0.4409 | 9.1963 | 21.2 | 99 | 278 | |
| MARD-Net(Ours) | 0.6926 | 0.4507 | 2.3301 | 4.3 | 168 | 548 | |
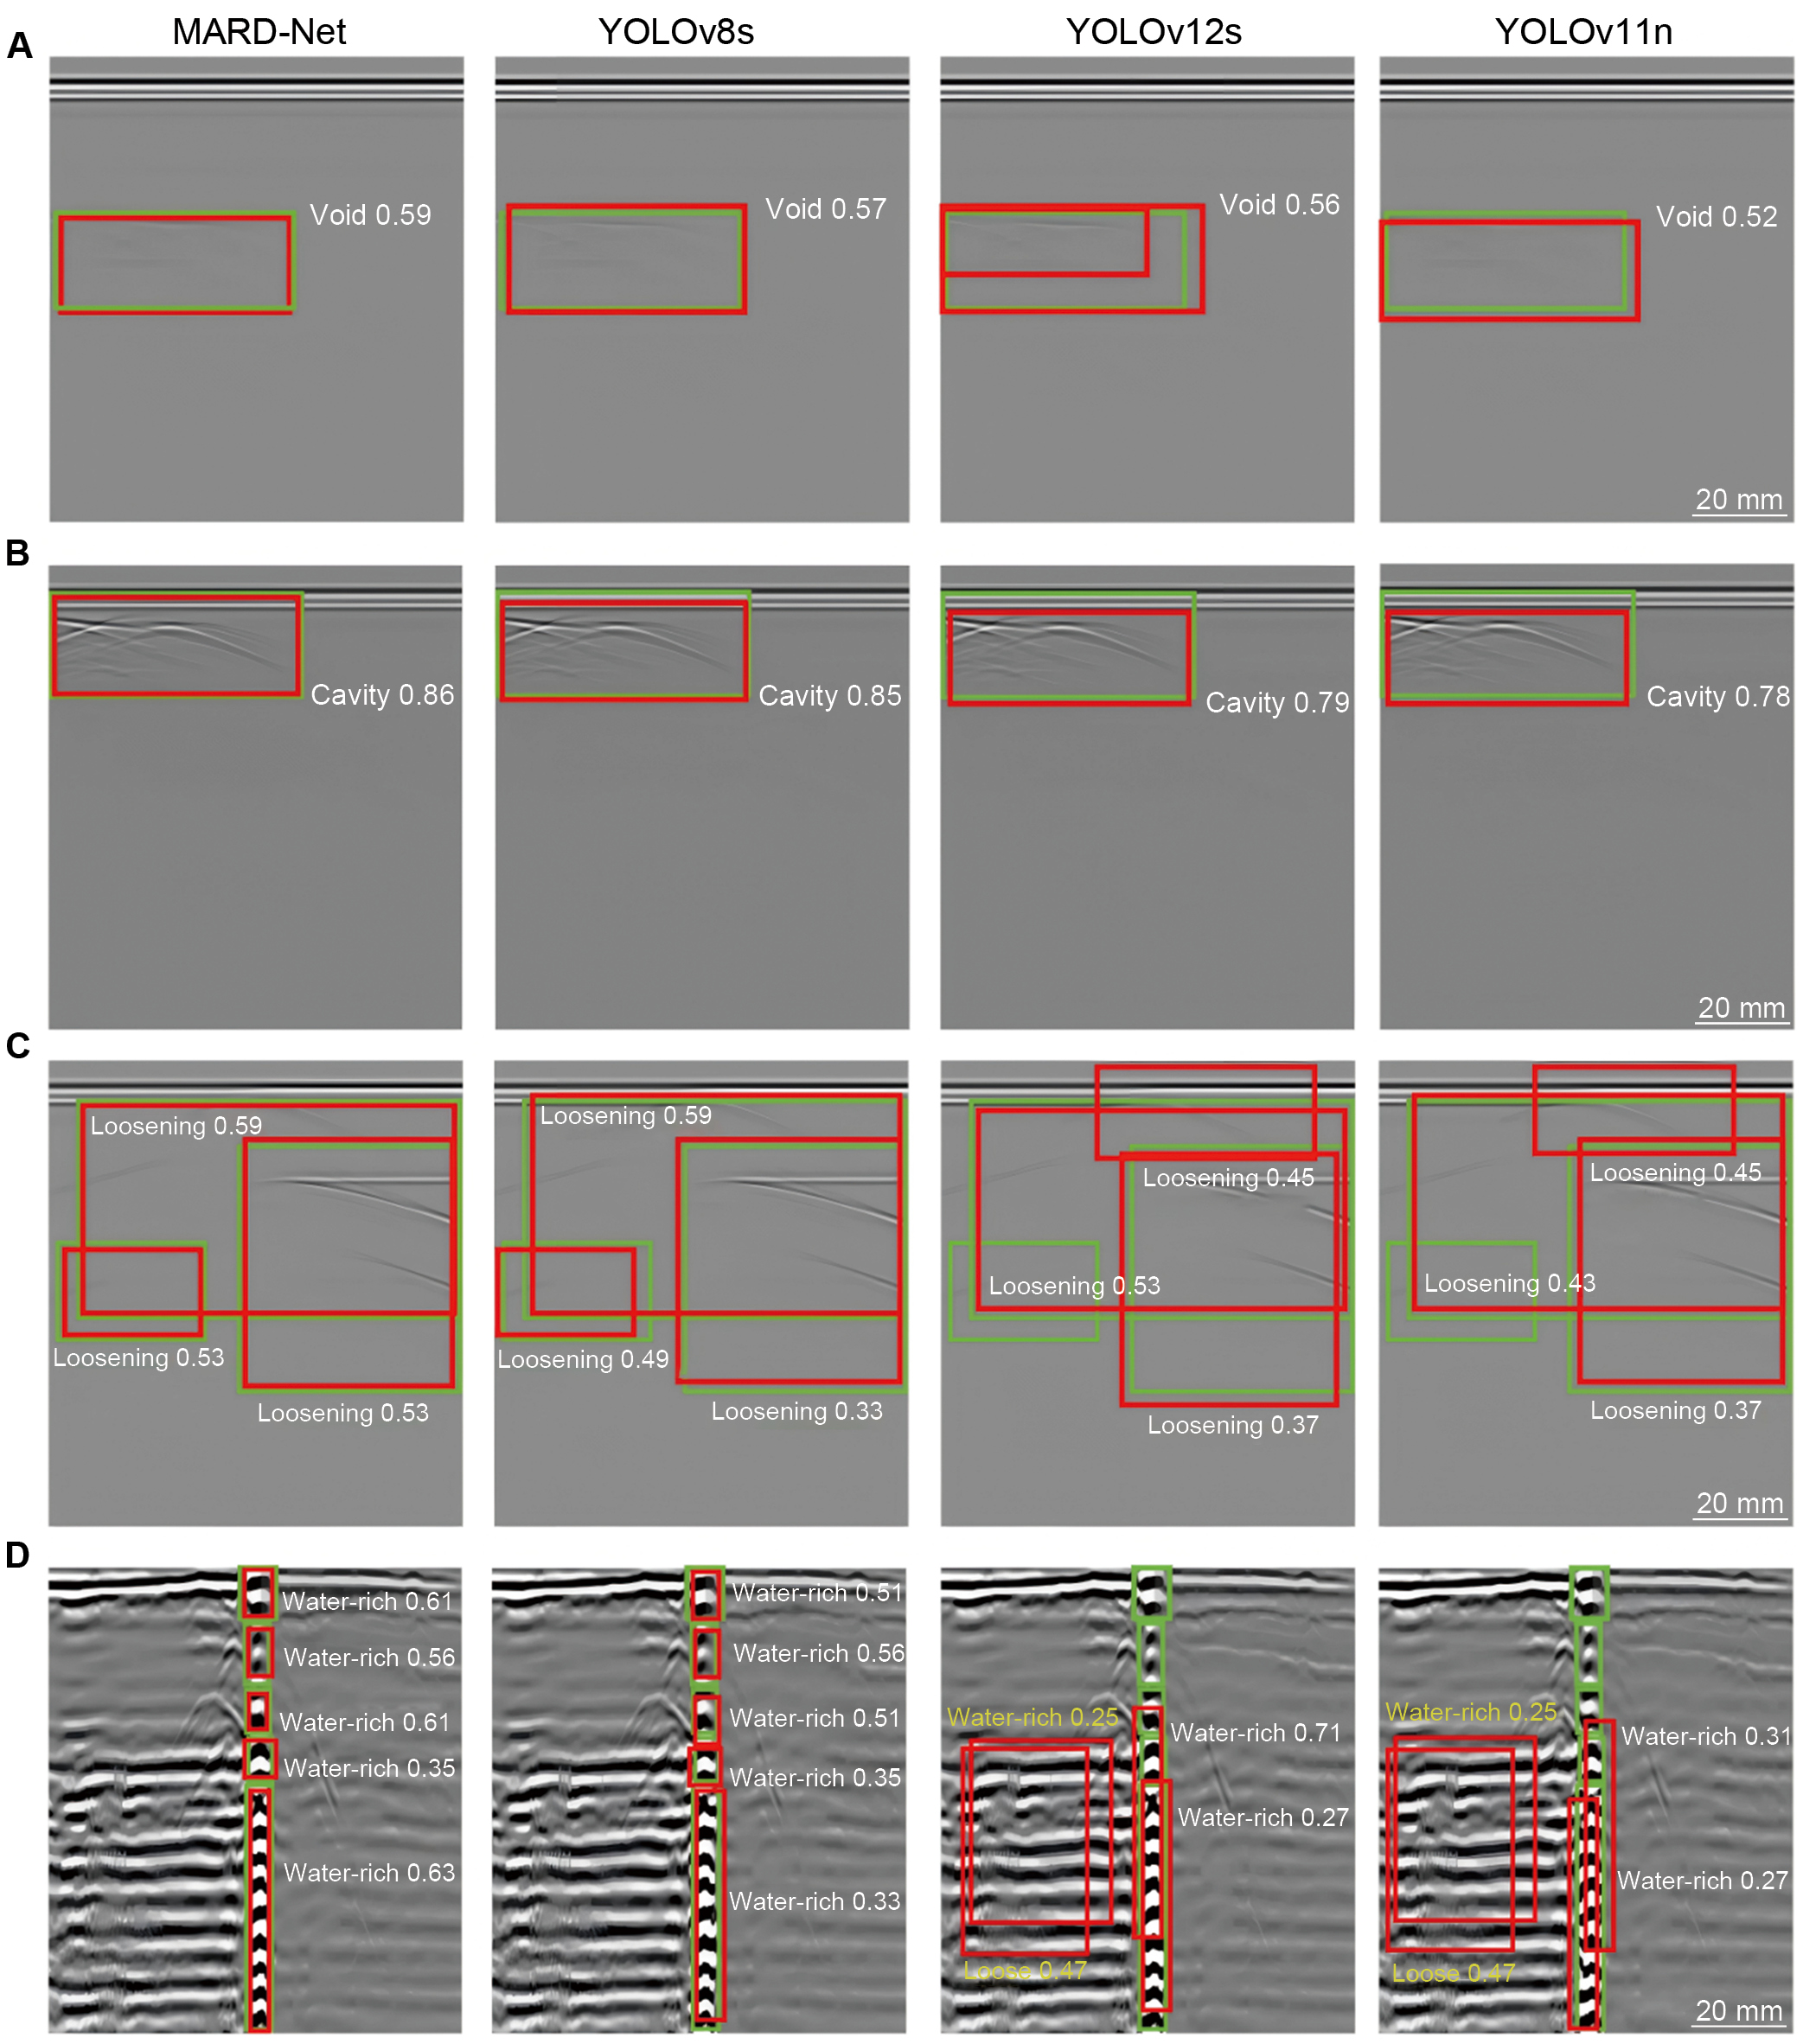
Compared with the baseline YOLOv11n [28], MARD-Net reduced parameters by 0.2532 M and computation by 2 GFLOPs, while substantially improving mAP@50. To visually evaluate the localization performance, Figure 9 presents a qualitative comparison where model predictions (solid red boxes) are superimposed onto ground truth annotations (solid green boxes). As illustrated in Table 6, the benchmark models (YOLOv8s [26], YOLOv11n [28], and YOLOv12s [29]) frequently exhibit spatial deviations or generate false positives, particularly in regions with dense interference. In contrast, MARD-Net demonstrates a high degree of overlap (IoU) between predictions and ground truth across all defect types—void, cavity, loosening, and water-rich. Notably, in complex backgrounds, MARD-Net effectively suppresses false positives where other models produce erroneous bounding boxes, while maintaining precise boundary delineation and higher confidence scores. Collectively, MARD-Net exhibits superior robustness and discriminative capability, validating its effectiveness for high-precision underground detection.
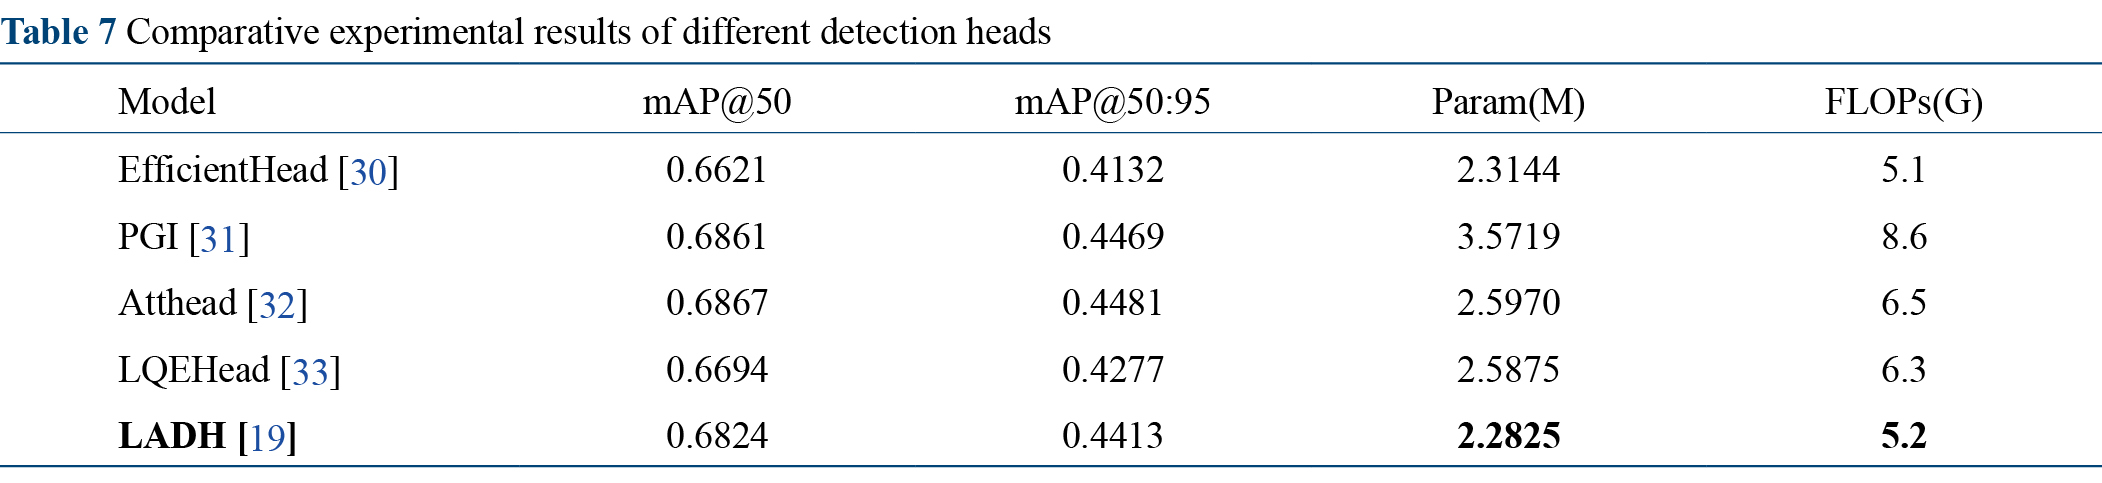
Comparison of different detection heads. To rigorously assess the contribution of the proposed LADH head, we systematically compared it with several representative detection heads integrated into a unified backbone (Table 7). While existing heads—such as EfficientHead [30], Programmable Gradient Information (PGI) [31], Attention Head (AttHead) [32], and Localization Quality Estimation Head (LQEHead) [33]—demonstrated improvements across most defect categories, their performance declined substantially when detecting subtle or sparsely distributed defects (e.g., loosening), highlighting limitations in capturing fine structural cues under low inter-class variation.
In contrast, LADH achieved a superior equilibrium between accuracy and computational efficiency. With the fewest parameters (2.28 M) and lowest computation (5.2 GFLOPs), it attained highly competitive precision (mAP@50 = 0.6824), outperforming other methods in categories where baselines were weak. This demonstrates LADH's enhanced feature discriminability under data-scarce and class-imbalanced conditions common in underground defect detection. Mechanistically, this capability stems from the regression branch's stacked DSConvs, which mathematically expand the effective receptive field to 7 × 7. This physical expansion enables the network to cover the complete hyperbolic diffraction tails of defects in a single pass, ensuring geometric integrity for irregular anomalies without the computational redundancy of large dense kernels. Notably, the performance gains observed in categories with limited training samples indicate stable and distinctive feature extraction, mitigating the long-tail distribution problem.
Overall, LADH improves feature robustness while maintaining a lightweight architectural design. Unlike other heads that occasionally achieve higher AP in isolated classes, LADH consistently enhances detection reliability across imbalanced categories, yielding superior overall performance in both mAP@50 and efficiency.
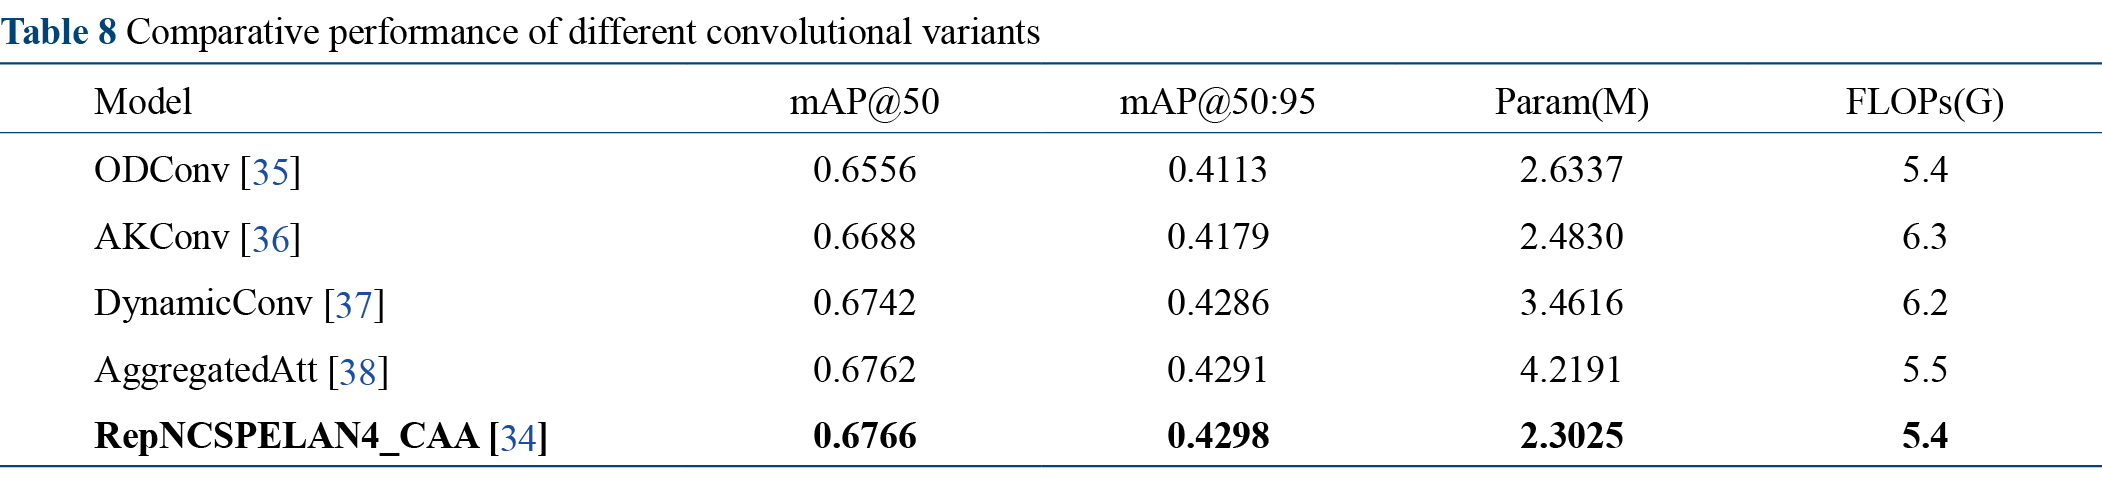
Comparison of different convolutional architectures. To further evaluate the impact of convolutional designs on subsurface defect detection, the proposed RepNCSPELAN4_CAA [34] module was systematically compared with representative deformable, dynamic, and frequency-domain convolution mechanisms. These included omni-dimensional dynamic convolution (ODConv) [35], arbitrary kernel convolution (AKConv) [36], DynamicConv [37], and AggregatedAtt [38] (Table 8). The results reveal notable performance disparities across four defect types: void, cavity, loosening, and water-rich.
ODConv and AKConv, despite introducing directional weighting or adaptive kernels, achieved mAP@50:95 of 0.4113 and 0.4179, respectively. This indicates limited capability in feature generalization for defects characterized by structural similarity, low texture, and low signal-to-noise ratios. While DynamicConv and AggregatedAtt improved detection in specific classes, particularly water-rich and void defects, by capturing local dynamic and frequency features; however, their higher parameters and computation did not translate to superior overall performance (mAP@50:95 of 0.4286 and 0.4291, respectively).
In contrast, RepNCSPELAN4_CAA achieved the highest overall performance while maintaining a lower parameter count (2.30 M) and reduced computational footprint (5.4 GFLOPs), attaining an mAP@50 of 0.6766 and mAP@50:95 of 0.4298. This demonstrates its capacity to effectively model fine-grained feature distinctions, especially for cavity and loosening, which exhibit morphologically similar signatures and blurred boundaries. Furthermore, its integration of channel attention with lightweight re-parameterization ensures stable feature responses in low-texture, low-contrast scenarios, thereby enhancing overall robustness. Specifically, the re-parameterization mechanism maximizes gradient flow during training to preserve fine-grained texture features of subtle defects like loosening. Meanwhile, the integrated CAA captures long-range dependencies using strip convolutions, anchoring faint textural anomalies to the broader structural context rather than relying solely on weak local features.
Overall, while other convolution types offer task-specific gains, RepNCSPELAN4_CAA provides the optimal equilibrium between detection precision and computational efficiency, rendering it particularly suitable for high-precision underground defect detection.
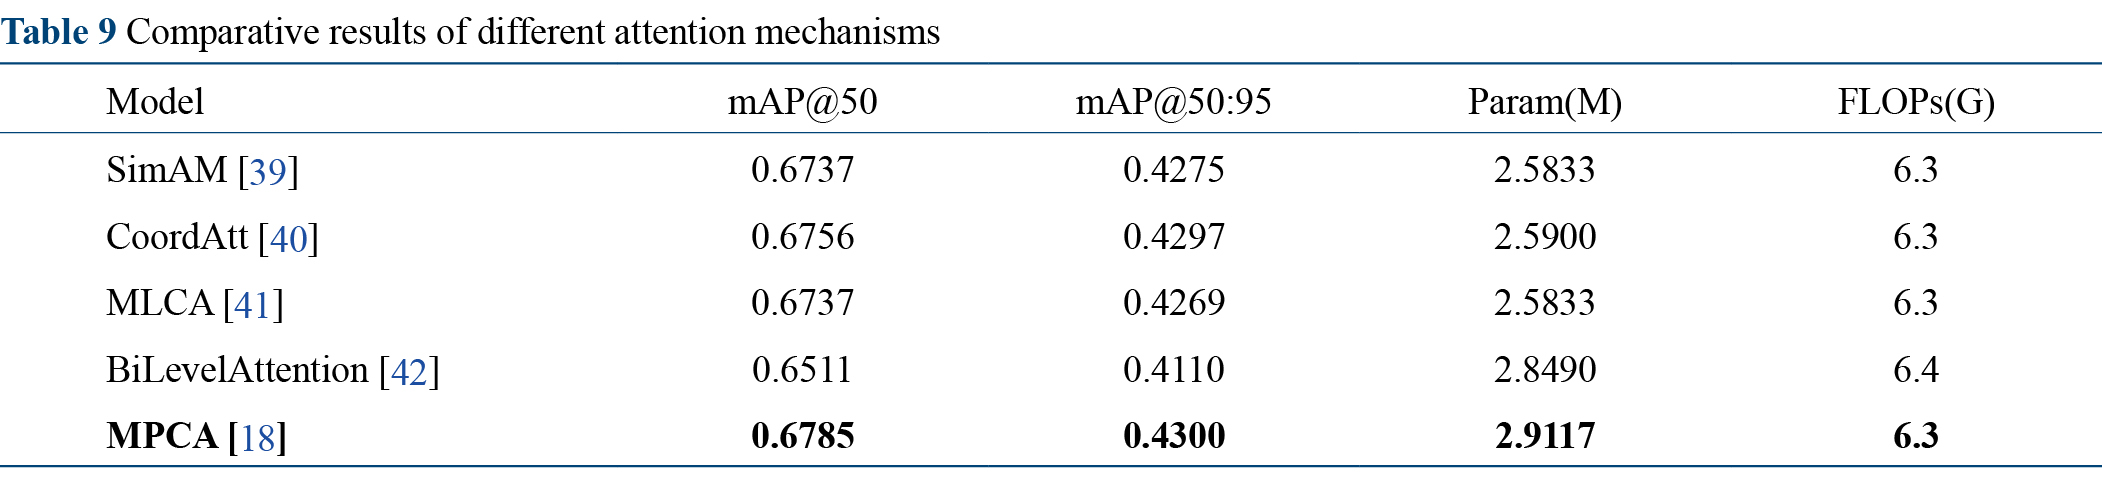
Comparison of different attention mechanisms. To systematically evaluate the efficacy of attention mechanisms in subsurface defect detection, we compared the MPCA module with several established methods, including Simple Attention Module (SimAM) [39], Coordinate Attention (CoordAtt) [40], Mixed Local Channel Attention (MLCA) [41], and BiLevelAttention [42] (Table 9). While these methods employ spatial modeling, coordinate encoding, channel recalibration, or dual-layer attention to enhance feature representation, their adaptability to the complex conditions of underground environments varies significantly.
SimAM and MLCA demonstrate moderate advantages in detecting high-texture defects such as void and water-rich regions but perform suboptimally for low-contrast, boundary-ambiguous defects (mAP@50 =0.6737). CoordAtt improves fine-grained localization through directional coordinate attention (mAP@50 = 0.6756) yet lacks comprehensive cross-channel modeling. BiLevelAttention, despite its sophisticated dual-layer design, exhibits inferior performance (mAP@50 = 0.6511) due to parameter complexity and sensitivity to the limited scales of the training data.
In contrast, MPCA achieves the highest overall performance (mAP@50 = 0.6785; mAP@50:95 = 0.4300), effectively enhancing multi-scale and multi-semantic feature interactions. This mechanism is particularly advantageous for structurally similar defects such as cavity and loosening, where MPCA strengthens characteristic feature responses via multi-path channel dependencies, thereby yielding superior discriminability. Crucially, MPCA addresses the signal attenuation problem in deep GPR layers. By aggregating global spatial information into channel descriptors via horizontal and vertical pooling, it amplifies weak deep-layer signals through global context weighting. This ensures that even if local signal intensity is diminished by physical attenuation, the defect's presence is reinforced, preventing missed detections at depth.
Overall, MPCA demonstrates enhanced feature stability, improved cross-class distinction, and superior detection performance, establishing it as a highly effective attention mechanism for subsurface defect detection.
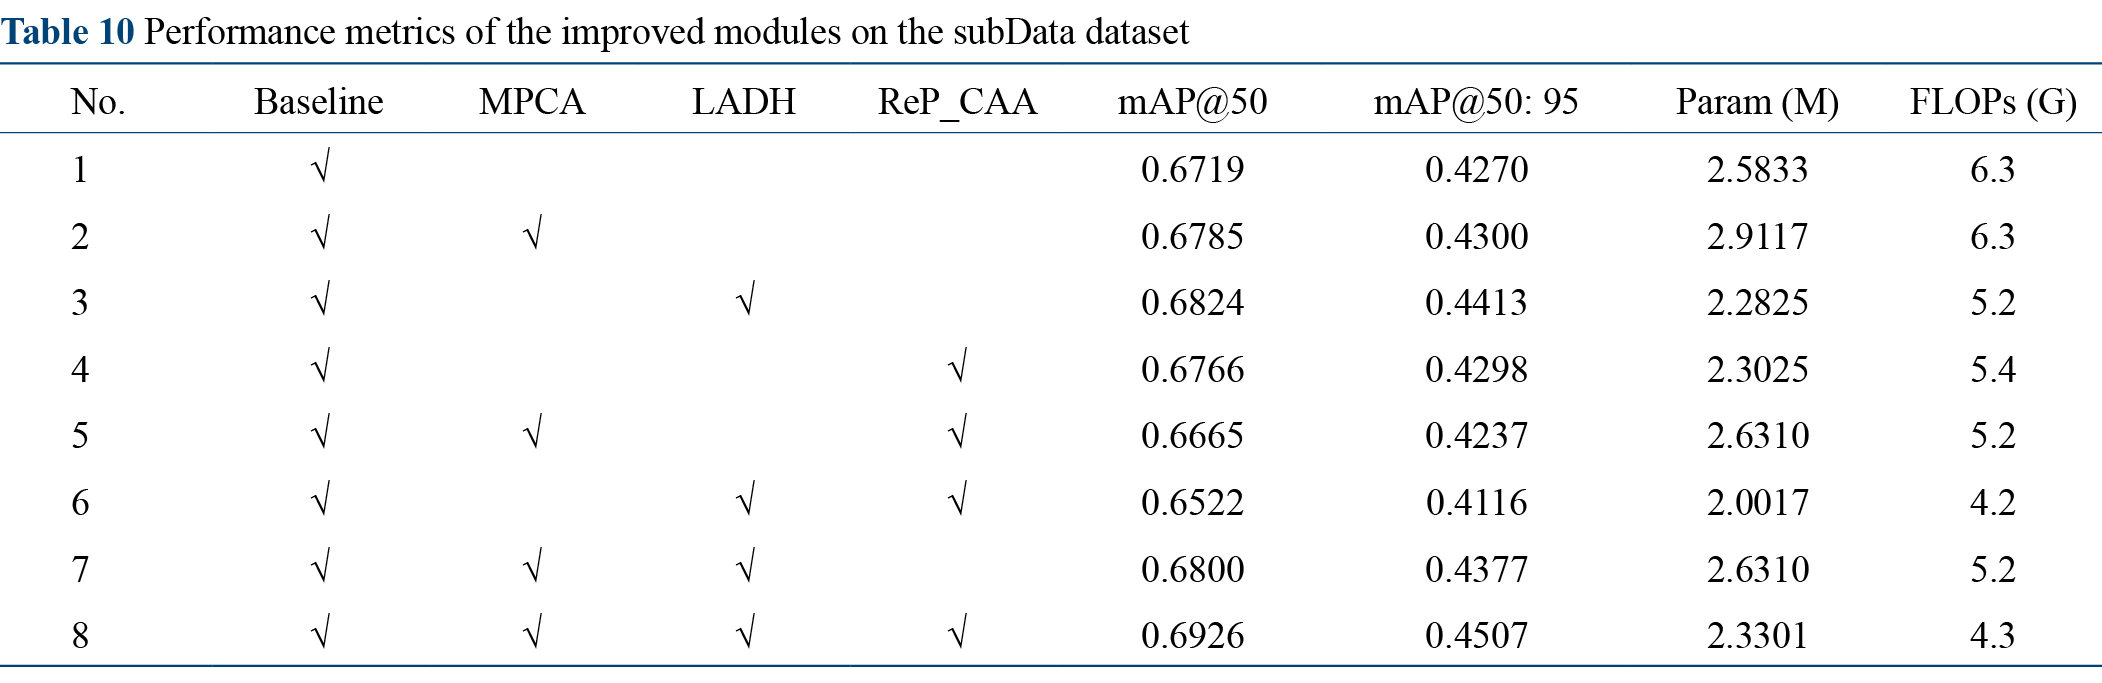
Comparison of key modules. To comprehensively evaluate the individual and collective contributions of the proposed modules to subsurface defect detection, we performed a stepwise ablation study. We incrementally integrated three key components—RepNCSPELAN4_CAA, LADH, and MPCA—into the YOLOv11 backbone and systematically analyzed their performance across four defect categories (void, cavity, loosening, and water-rich, as shown in Table 10). Ablation experiments progressed from single-module enhancements to dual- and triple-module combinations to reveal complementarity and synergy.
Individually, the integration of RepNCSPELAN4_CAA improved mAP@50 from 0.6719 to 0.6766. This gain is attributed to its ability to capture weak edge textures and void structures via re-parameterized bottlenecks and channel attention mechanisms. The LADH module, functioning as a dynamic hierarchical detection head, further elevated mAP@50 to 0.6824 by enhancing spatial-scale adaptation. Similarly, MPCA augmented multi-path channel features, particularly for water-rich and cavity defects, achieving an mAP@50 of 0.6785. However, single-module improvements exhibited high variance in mAP@50:95, indicating limited stability across diverse defect scales and classes when modules are used in isolation.
Dual-module combinations revealed varied synergistic outcomes. The combination of RepNCSPELAN4_CAA + LADH significantly reduced computational cost to 4.2 GFLOPs but resulted in an mAP@50 of 0.6522, suggesting a potential bottleneck in feature richness when the backbone and head are both heavily optimized for lightness simultaneously without adequate attention mechanisms. Similarly, RepNCSPELAN4_CAA + MPCA exhibited structural conflicts, lowering mAP@50:95 to 0.4237. In contrast, the pair of LADH + MPCA yielded a robust mAP@50 of 0.6800 with only 2.63 M parameters. This success stems from their complementary roles: LADH provides dynamic spatial modeling while MPCA delivers cross-channel semantic enhancement.
The complete integration of RepNCSPELAN4_CAA, LADH, and MPCA achieved optimal performance, with mAP@50 reaching 0.6926. This demonstrates the synergistic advantage of combining re-parameterized channel attention, dynamic detection heads, and multi-path channel enhancement to form a unified, high-precision framework.
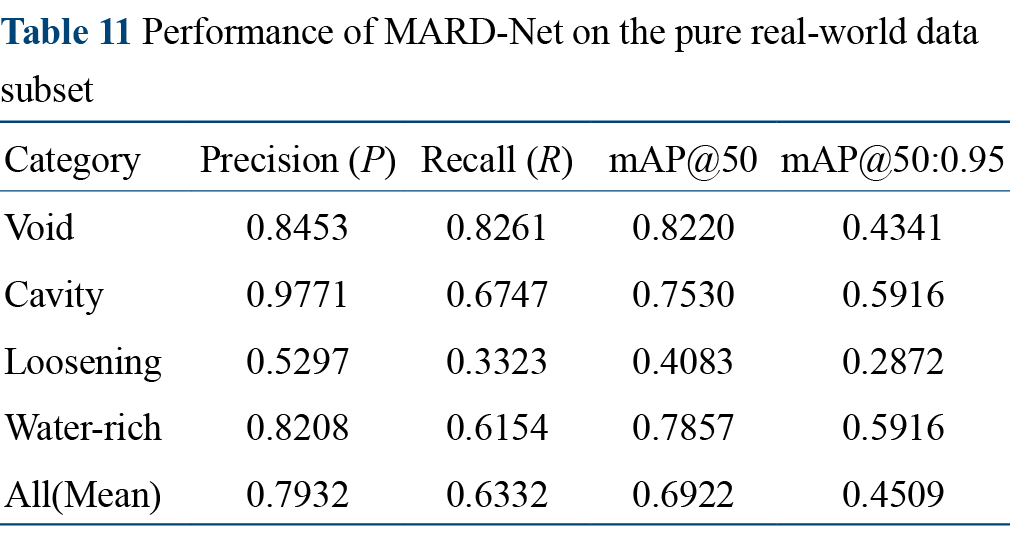
To further validate the generalization capability of MARD-Net and ensure that the model has not overfitted to the idealized features of the simulation data, we conducted an additional evaluation on an additional exclusively empirical dataset. This subset integrates newly acquired field data from the North Second Ring Road in Zhejiang Province—annotated per established protocols—with the existing GS8000 GPR B-scan images from the original test set. Such an evaluation is critical for assessing practical applicability in complex engineering environments characterized by irregular noise, clutter, and heterogeneous geological backgrounds—features that simulations often fail to fully replicate.
The quantitative results, presented in Table 11, demonstrate the model's robustness in non-idealized conditions. MARD-Net achieves a Precision of 0.7932, a recall of 0.6332, and an mAP@50 of 0.6922 on the empirical subset. Although a marginal performance attenuation is observed compared to the hybrid dataset benchmark (0.6926) —a phenomenon attributable to the inherent complexity of background clutter and signal attenuation in field data—MARD-Net maintains a substantial performance advantage over the baseline YOLOv11n.
Specifically, the detection of void remains highly accurate, demonstrating that the MPCA module effectively captures global contextual information to compensate for the weak signals often found in field data. Furthermore, the LADH head proves effective in precise boundary localization even without the clean edges typical of simulated defects. These results confirm that MARD-Net has successfully learned discriminative feature representations robust to real-world interference, rather than merely memorizing simulated patterns, thereby validating its suitability for in-situ underground defect detection.
This study presents MARD-Net, a lightweight, high-precision deep learning framework for the detection of subsurface road defects using GPR imagery. By addressing inherent challenges such as high geological noise, complex background clutter, and the subtlety of defect signatures, MARD-Net integrates three key modules to achieve an optimal equilibrium between computational efficiency and detection accuracy. The principal contributions and findings are summarized as follows:
RepNCSPELAN4_CAA enables robust feature extraction via multi-dimensional fusion. Its core principle synergizes re-parameterization with context awareness. During the training phase, multi-branch convolutions enrich feature representation; conversely, during inference, these branches are mathematically merged into a single-path architecture, delivering performance gains with zero additional inference latency. The integrated CAA utilizes lightweight 1D strip convolutions to efficiently capture long-range spatial dependencies, facilitating the precise discrimination of weak defect signals amidst complex geological noise.
LADH optimizes the precision-efficiency trade-off through asymmetric decoupling. The LADH separates the localization and classification tasks. The localization branch employs a stack of DSConv to expand the receptive field from 3 × 3 to 7 × 7, ensuring fine-grained spatial modeling. Simultaneously, the classification branch utilizes 1 × 1 convolutions to enhance cross-channel interaction and semantic abstraction. This design reduces parameters by 0.30 M and computational load by 1.1 GFLOPs, while maintaining high-precision defect localization.
MPCA enhances recognition of complex targets via multi-path information encoding. Going beyond global average pooling, the MPCA mechanism introduces horizontal and vertical one-dimensional pooling operations to embed precise coordinate information into the feature map. This multi-path strategy allows adaptive integration of global and local context, effectively mitigating detection failures caused by weak or unevenly distributed defect signals.
Synergistic integration of these modules yields substantial performance gains. Ablation experiments demonstrate that their combination is not merely additive but produces optimal synergy. Compared with the baseline YOLOv11n, MARD-Net achieves a reduction in computation while increasing mAP@50 by 0.0207 (0.6719 → 0.6926) and mAP@50:95 by 0.0237 (0.4270 → 0.4507), confirming MARD-Net as an efficient, accurate, and robust tool for subterranean defect detection with high practical applicability.
While the proposed MARD-Net demonstrates superior performance, we acknowledge certain limitations in the dataset construction. The gprMax simulations employed fixed dielectric constants for subsurface materials, representing an idealized condition. In actual engineering scenarios, media properties are heterogeneous, with dielectric constants fluctuating due to variations in moisture content and compaction. This simplification may limit the model's adaptability to extreme geological anomalies. Future work will address this by introducing random dielectric perturbations and stochastic noise models into the simulation process to better mimic the complexity of real-world underground environments, thereby further enhancing the model's generalization capability.
Wenbo Zhang: Conceptualization; methodology; software; data curation; visualization; validation; formal analysis; writing–original draft. Yi Liang: Investigation. Jueqiang Tao: Funding acquisition. Qing Yang: Visualization. Zican Liu: Investigation; Data curation. Chenyang Li: Investigation.
This work was supported by Zhejiang Natural Science Foundation (Grant No. LY23E080002).
The data that support the findings of this study are available from the corresponding author upon reasonable request.
X. C. Sui, Z. Leng, and S. Wang, "Machine Learning-Based Detection of Transportation Infrastructure Internal Defects Using Ground-Penetrating Radar: A State-of-the-Art Review," Intelligent Transportation Infrastructure 2, no. 1 (2023): 1–18, https://doi.org/10.1093/iti/liad004.
Z. Zou, K. Chen, Z. Shi, Y. Guo, and J. Ye, "Object Detection in 20 Years: A Survey," Proceedings of the IEEE 111, no. 3 (2023): 257–276, https://doi.org/10.1109/JPROC.2023.3238524.
R. Varghese and M. Sambath, "A Comprehensive Review on Two-stage Object Detection Algorithms," paper presented at the 2023 International Conference on Quantum Technologies, Communications, Computing, Hardware and Embedded Systems Security (iQ-CCHESS), Kottayam, India, September 15–16, 2023, https://doi.org/10.1109/iQ-CCHESS56596.2023.10391506.
M. T. Pham and S. Lefèvre, "Buried Object Detection from B-Scan Ground Penetrating Radar Data Using Faster-RCNN," paper presented at the IEEE International Geoscience and Remote Sensing Symposium (IGARSS), Valencia, Spain, July 22–27, 2018, https://doi.org/10.1109/IGARSS.2018.8517683.
X. Xu, Y. Lei, and F. Yang, "Railway Subgrade Defect Automatic Recognition Method Based on Improved Faster R-CNN," Scientific Programming 2018, no. 2 (2018): 1–12, https://doi.org/10.1155/2018/4832972.
F. Niu, Y. Huang, P. He, Q. Wu, and Y. Zhang, "Intelligent Recognition of Ground Penetrating Radar Images in Urban Road Detection: A Deep Learning Approach," Journal of Civil Structural Health Monitoring 14, no. 5 (2024): 1917–1933, https://doi.org/10.1007/s13349-024-00818-5.
J. Redmon, S. Divvala, R. Girshick, and A. Farhadi, "You Only Look Once: Unified, Real-Time Object Detection," paper presented at the IEEE Conference on Computer Vision and Pattern Recognition (CVPR), Las Vegas, NV, USA, June 27–30, 2016, https://doi.org/10.1109/CVPR.2016.91.
Z. K. Ni, D. Zhao, S. B. Ye, and G. Y. Fang, "City Road Cavity Detection Using YOLOv3 for Ground-Penetrating Radar," paper presented at the 18th International Conference on Ground Penetrating Radar, Golden, Colorado, June 14–19, 2020, https://doi.org/10.1190/gpr2020-100.1.
R. Mehta, P. K. R. Rao, M. Raj, and A. Khosla, "CNN-Based Sub-Surface Object Detection Using Ground Penetrating Radar," paper presented at the 11th International Workshop on Advanced Ground Penetrating Radar (IWAGPR), Valletta, Malta, December 1–4, 2021, https://doi.org/10.1109/IWAGPR50767.2021.9843163.
R. M. Hu, X. Li, X. Jing, J. Q. Wu, and Q. B. Wei, "Application of YOLOv7 in GPR B-Scan Image Interpretation," Bulletin of Surveying and Mapping 2023, no. 8 (2023): 29–33, http://tb.chinasmp.com/CN/Y2023/V0/I8/29.
D. S. Feng and Z. L. Yang, "Automatic Recognition of Ground Penetrating Radar Image of Tunnel Lining Structure Based on Deep Learning," Progress in Geophysics 35, no. 4 (2020): 1552–1556, https://doi.org/10.6038/pg2020DD0325.
C. Yi, J. Liu, T. Huang, H. Xiao, and H. Guan, "An Efficient Method of Pavement Distress Detection Based on Improved YOLOv7," Measurement Science and Technology 34, no. 11 (2023): 115402, https://doi.org/10.1088/1361-6501/ace929.
T. T. Fang, C. S. Wang, J. Wang, and Y. B. Du, "Pipeline Location Method of Ground-Penetrating Radar Images Based on YOLOv8n," Foreign Electronic Measurement Technology 42, no. 11 (2023): 170–177, https://doi.org/10.19652/j.cnki.femt.2305179.
W. Wang, "Advanced Auto Labeling Solution with Added Features," GitHub repository, 2023, https://github.com/CVHub520/X-AnyLabeling.
Ministry of Housing and Urban-Rural Development of the P.R.C. Technical Standard for Comprehensive Detection and Risk Assessment of Urban Underground Defects. China Architecture & Building Press JGJ/T 437-2018. 2018.
Ultralytics, "Ultralytics YOLO11," GitHub repository, 2024, https://github.com/ultralytics/ultralytics.
M. Yaseen, "What Is YOLOv8: An In-Depth Exploration of the Internal Features of the Next-Generation Object Detector," arXiv preprint, arXiv: 2408.15857, August 28, 2024, https://doi.org/10.48550/arXiv.2408.15857.
Z. Zhou, A. He, Y. Wu, R. Yao, X. Xie, and T. Li, "Spatial-Frequency Dual Domain Attention Network for Medical Image Segmentation," paper presented at the 2024 IEEE International Conference on Bioinformatics and Biomedicine (BIBM), Lisbon, Portugal, December 3–6, 2024, https://doi.org/10.1109/BIBM62325.2024.10822613.
J. Zhang, Z. Chen, G. Yan, Y. Wang, and B. Hu, "Faster and Lightweight: An Improved YOLOv5 Object Detector for Remote Sensing Images," Remote Sensing 15, no. 20 (2023): 4974, https://doi.org/10.3390/rs15204974.
X. Cai, Q. Lai, Y. Wang, W. Wang, Z. Sun, and Y. Yao, "Poly Kernel Inception Network for Remote Sensing Detection," paper presented at the IEEE Conference on Computer Vision and Pattern Recognition (CVPR), Seattle, WA, USA, June 17–21, 2024, https://doi.org/10.48550/arXiv.2403.06258.
S. Ren, K. He, R. Girshick, and J. Sun, "Faster R-CNN: Towards Real-time Object Detection with Region Proposal Networks," IEEE Transactions on Pattern Analysis and Machine Intelligence 39, no. 6 (2017): 1137–1149, https://doi.org/10.1109/TPAMI.2016.2577031.
Z. Cai and N. Vasconcelos, "Cascade R-CNN: Delving into High Quality Object Detection," paper presented at the IEEE/CVF Conference on Computer Vision and Pattern Recognition (CVPR), Salt Lake City, UT, USA, June 18–22, 2018, https://doi.org/10.1109/CVPR.2018.00644.
H. Zhang, F. Li, S. Liu, et al., "DINO: DETR with Improved DeNoising Anchor Boxes for End-to-End Object Detection," paper presented at the International Conference on Learning Representations (ICLR), Kigali, Rwanda, May 1–5, 2023, https://doi.org/10.48550/arXiv.2203.03605.
C. Feng, Y. Zhong, Y. Gao, M. R. Scott, and W. Huang, "TOOD: Task-Aligned One-Stage Object Detection," paper presented at the IEEE/CVF International Conference on Computer Vision (ICCV), Montreal, QC, Canada, October 11–17, 2021, https://doi.org/10.1109/ICCV48922.2021.00349.
T. Y. Lin, P. Goyal, R. Girshick, K. He, and P. Dollár, "Focal Loss for Dense Object Detection," paper presented at the IEEE International Conference on Computer Vision (ICCV), Venice, Italy, October 22–29, 2017, https://doi.org/10.1109/ICCV.2017.324.
M. Sohan, T. Sai Ram, and C. V. Rami Reddy, "A Review on YOLOv8 and Its Advancements," in proceedings of the Data Intelligence and Cognitive Informatics, edited by I. J. Jacob, S. Piramuthu, and P. Falkowski-Gilski, 491–502, Springer, 2024, https://doi.org/10.1007/978-981-99-7962-2_39.
A. Wang, H. Chen, L. Liu, et al., "YOLOv10: Real-Time End-to-End Object Detection," paper presented at the Conference on Neural Information Processing Systems (NeurIPS), Vancouver, BC, Canada, December 10–15, 2024, https://doi.org/10.48550/arXiv.2405.14458.
R. Khanam and M. Hussain, "YOLOv11: An Overview of the Key Architectural Enhancements," arXiv preprint, arXiv: 2410.17725, October 23, 2024, https://doi.org/10.48550/arXiv.2410.17725.
Y. Tian, Q. Ye, and D. Doermann, "YOLOv12: Attention-Centric Real-Time Object Detectors," arXiv preprint, arXiv: 2502.12524, February 18, 2025, https://doi.org/10.48550/arXiv.2502.12524.
M. Tan, R. Pang, and Q. V. Le, "EfficientDet: Scalable and Efficient Object Detection," paper presented at the IEEE/CVF Conference on Computer Vision and Pattern Recognition (CVPR), Seattle, WA, USA, June 14–19, 2020, https://doi.org/10.1109/CVPR42600.2020.01079.
C. Y. Wang, I. H. Yeh, and H. Y. Mark Liao, "YOLOv9: Learning What You Want to Learn Using Programmable Gradient Information," paper presented at the European Conference on Computer Vision (ECCV), Milan, Italy, September 29 to October 4, 2024, https://doi.org/10.1007/978-3-031-72751-1_1.
J. B. Cordonnier, A. Loukas, and M. Jaggi, "Multi-Head Attention: Collaborate Instead of Concatenate," arXiv preprint, arXiv: 2006.16362, June 29, 2020, https://doi.org/10.48550/arXiv.2006.16362.
X. Li, W. Wang, X. Hu, J. Li, J. Tang, and J. Yang, "Generalized Focal Loss V2: Learning Reliable Localization Quality Estimation for Dense Object Detection," paper presented at the IEEE/CVF Conference on Computer Vision and Pattern Recognition (CVPR), Nashville, TN, USA, June 19–25, 2021, https://doi.org/10.1109/CVPR46437.2021.01146.
M. Hu, J. Feng, J. Hua, et al., "Online Convolutional Reparameterization," paper presented at the IEEE/CVF Conference on Computer Vision and Pattern Recognition (CVPR), New Orleans, LA, USA, June 19–24, 2022, https://doi.org/10.1109/CVPR52688.2022.00065.
C. Li, A. Zhou, and A. Yao, "Omni-Dimensional Dynamic Convolution," paper presented at the International Conference on Learning Representations (ICLR), Virtual, April 25–29, 2022, https://doi.org/10.48550/arXiv.2209.07947.
X. Zhang, Y. Song, T. Song, et al., "AKConv: Convolutional Kernel with Arbitrary Sampled Shapes and Arbitrary Number of Parameters," arXiv preprint, arXiv: 2311.11587, November 20, 2023, https://doi.org/10.48550/arXiv.2311.11587.
Y. Chen, X. Dai, M. Liu, D. Chen, L. Yuan, and Z. Liu, "Dynamic Convolution: Attention Over Convolution Kernels," paper presented at the IEEE/CVF Conference on Computer Vision and Pattern Recognition (CVPR), Seattle, WA, USA, June 14–19, 2020, https://doi.org/10.1109/CVPR42600.2020.01104.
D. Shi, "TransNeXt: Robust Foveal Visual Perception for Vision Transformers," paper presented at the IEEE/CVF Conference on Computer Vision and Pattern Recognition (CVPR), Seattle, WA, USA, June 17–21, 2024, https://doi.org/10.48550/arXiv.2311.17132.
L. Yang, R. Y. Zhang, L. Li, and X. Xie, "SimAM: A Simple, Parameter-Free Attention Module for Convolutional Neural Networks," paper presented at the International Conference on Machine Learning (ICML), Virtual, July 18–24, 2021, http://proceedings.mlr.press/v139/yang21o.html.
Q. Hou, D. Zhou, and J. Feng, "Coordinate Attention for Efficient Mobile Network Design," paper presented at the IEEE/CVF Conference on Computer Vision and Pattern Recognition (CVPR), Nashville, TN, USA, June 19–25, 2021, https://doi.org/10.1109/CVPR46437.2021.01350.
D. Wan, R. Lu, S. Shen, T. Xu, X. Lang, and Z. Ren, "Mixed Local Channel Attention for Object Detection," Engineering Applications of Artificial Intelligence 123, Part C (2023): 106442, https://doi.org/10.1016/j.engappai.2023.106442.
L. Zhu, X. Wang, Z. Ke, W. Zhang, and R. Lau, "BiFormer: Vision Transformer with Bi-Level Routing Attention," paper presented at the IEEE/CVF Conference on Computer Vision and Pattern Recognition (CVPR), Vancouver, BC, Canada, June 18–22, 2023, https://doi.org/10.48550/arXiv.2303.08810.
 Top
Top