ContentsFigures & Tables
In the context of global energy depletion and increasing environmental concerns, lithium-ion batteries (LIBs) are being widely adopted across diverse sectors owing to their superior performance and reliability [1–3]. Among various candidates, spinel lithium titanate oxide (Li4Ti5O12, LTO) has emerged as a promising anode material for high-power electric mobility, including trains, ships, buses, electric vehicles, and heavy-duty transport, owing to its exceptional safety and structural stability [4, 5]. Despite being a zero-strain electrode material, however, LTO suffers from severe degradation under abusive operating conditions, which adversely impacts both its high-rate performance and safety. As a widely used backup energy system in rail transit, LTO batteries often need to be float-charged at full capacity. However, due to the individual differences among the batteries in the battery pack, there is often local constant-voltage overcharging behavior. Under normal circumstances, the battery is kept at full capacity and charged at a constant voltage with a small current. But under the control of the BMS, the voltage distribution among different batteries may change due to individual differences or a fault in a certain battery, thereby causing high-voltage constant-voltage overcharging. Previous studies have mainly focused on traditional graphite-based lithium battery energy systems such as lithium cobalt oxide (LCO), lithium iron phosphate (LFP) [6, 7], while research on constant voltage overcharging of the currently widely used LTO batteries is relatively scarce. In recent years, numerous studies have investigated the degradation mechanisms of LTO batteries under a range of operating conditions and extreme environments.
For instance, Chen et al. [8] examined the durability of high-power LTO/LiCoO2 batteries across five distinct state-of-charge (SOC) windows, employing a 20% depth of discharge (DOD) while exploring the effects of various discharge voltage limits. Their results revealed that degradation intensifies at lower SOC levels and reduced cutoff voltages. In a follow-up study, the authors developed an aging-aware open-circuit potential (OCP) model for LTO batteries that is capable of capturing OCP fluctuations and enabling the precise identification of degradation mechanisms with a reconstruction error of less than 8 mV [9]. Similarly, Baure et al. [10] assessed next-generation LTO batteries to predict aging behavior under grid application scenarios. Their projections revealed that the capacity significantly decreased after six years at 35 °C and low SOC, whereas under milder conditions (< 35 °C), the capacity loss remained below 20%, suggesting a potential service life of up to 20 years. In another study, Soltani et al. [11] investigated cycling-induced aging in LTO cells under different temperatures, high-current regimes, and various cycle depths and applied a feed-forward neural network to model capacity degradation trends. In practical applications, constant-voltage overcharging (CVOC) involves applying a low current and maintaining a fixed voltage across either individual cells or series-connected packs [7]. While this method compensates for self-discharge and preserves overall energy capacity, it also introduces safety risks. In electric transportation systems, LTO batteries are frequently exposed to CVOC during the response delay of battery management systems (BMSs). Consequently, overcharge-induced cycling degradation remains a significant concern, particularly at high SOCs. Besides, several studies have been conducted about the CVOC effect on lithium-ion battery. Lai et al. [12] proposed a quantitative method based on the behavior of battery balancing systems for detecting internal short circuit (ISC) in lithium-ion battery packs under constant voltage charging conditions, and successfully verified its effectiveness. In addition, Tian et al. [13] investigated the application of lithium-titanium batteries in the auxiliary systems of rail transit, with a focus on analyzing the aging characteristics of the batteries under constant voltage charging conditions. It was found that CVOC has a significant impact on battery performance, especially leading to capacity loss under high-temperature conditions. Based on the previous studies, Yin et al. [14] summarized how external temperature, float voltage, and cell inconsistency affect lithium-ion battery float charging. Extreme temperatures accelerate failure, with high temperatures causing electrolyte decomposition and low temperatures inducing lithium dendrites. Both high and low charge voltages reduce battery lifespan. Tsujikawa et al. [15] explored the deterioration of lithium-ion batteries with manganese spinel cathodes during constant voltage overcharging. They discovered that capacity loss is more severe at elevated temperatures and is mainly attributed to anode degradation. The battery capacity reduction surpasses the expected extent from electrode deterioration alone, indicating that lithium-ion imbalance, likely due to manganese deposition on the anode, is a crucial factor. Although researchers have conducted extensive studies on constant-voltage overcharging of batteries, yet the effect on thermal stability of lithium batteries after overcharging is also very important and requires further research.
In this work, we systematically investigated the critical overcharge voltage threshold that accelerates LTO degradation. When the applied voltage exceeds 3.5 V, the cells sustain irreversible damage, leading to a reduced charging capacity. Specifically, after several CVOC cycles at 4.0 V, the discharge capacity retention decreases to 60.08%, whereas it is 98.85% under standard cycling. Postmortem analyses revealed fragmentation of the positive electrode and deterioration of the electrode/electrolyte interfaces, resulting in active material loss and depletion of Li+. Furthermore, decomposition products such as Li2CO3 reduce the internal electrical conductivity, whereas increased organic interfacial components markedly compromise the thermal stability. The self-heating onset temperature decreases by 44.8 °C, underscoring the severe thermal risks posed by CVOC. Overall, the degradation of the electrochemical performance and thermal stability induced by overcharging highlights critical challenges for the practical deployment of LTO batteries. Understanding these degradation pathways is essential for improving battery management strategies and extending the service life of LTO-based power systems.
Commercial 15 Ah lithium-ion pouch cells with nickel-cobalt-manganese (NCM) cathodes and LTO anodes were employed in this study. To ensure reproducibility, at least three cells were tested under each condition. The cell condition was continuously monitored through periodic diagnostic tests throughout the overcharge process. Following testing, the cells were disassembled, and material characterization was conducted to validate the findings from the electrochemical evaluations. Under 1C constant current followed by constant voltage charging (CCCV, referred to as normal charging, NC), a nominal capacity of 15 Ah was obtained, with the cutoff voltage and current set at 2.7 V and 0.1C, respectively. The cells demonstrated exceptional cycling stability, delivering more than 20,000 cycles at a continuous 5C charge/discharge rate between 1.5 and 2.7 V (100% DOD), as specified. A summary of the cell specifications, including nominal capacity, cutoff voltages, chemistry, and other relevant parameters, is provided in Table S1. The reference performance tests (RPTs) consisted of a series of capacity measurements conducted after each overcharging period. Ten cycles at a current rate of 1C were performed to evaluate the reversible capacity of the LTO cells. In addition, a reduced current rate (0.1C) was applied to determine the quasistationary open-circuit voltage (qOCV), with a 2 h rest period between charging and discharging, as shown in Fig. S1.
Two charge/discharge modes were employed: the conventional CCCV mode and the CVOC mode. The cycling protocol consisted of constant current (CC) charging and discharging at 1C (15 A), followed by a 5 min rest period. During charging, once the cutoff voltage was reached, a constant voltage (CV) step was applied until the current decreased below 0.1C, ensuring complete lithiation of the anode. The same CC charging protocol was applied to the overcharged battery samples. Two overcharge cycling modes were then implemented: (i) variable-voltage CVOC (VV-CVOC) cycles at 2.7, 3.0, 3.3, 3.5, 3.7, 4.0, 4.3, 4.5, and 5.0 V, and (ii) CVOC cycles at a fixed voltage (Fig. S2). For VV-CVOC cycling, CVOC was conducted at different voltages for 1 h each, with capacity normalization cycles between successive overcharge cycles. During CVOC cycling, overcharging was performed at a constant voltage for 24 h, which was also interspersed with capacity normalization cycles. Electrochemical cycling was carried out via a multichannel 5 V-20 A battery tester (CT-4008-5V20A, NEWARE TECHNOLOGY Ltd.). All the cells were placed in a temperature-controlled chamber maintained at 25 °C. To minimize temperature variations under different cycling conditions, each battery was secured in a custom-designed fixture that ensured uniform stress distribution. The fixture consisted of two parallel polyamide plates held together at the ends by four sets of nuts and bolts, with the battery positioned between the plates and fastened tightly with screws to immobilize it during cycling.
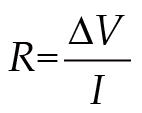
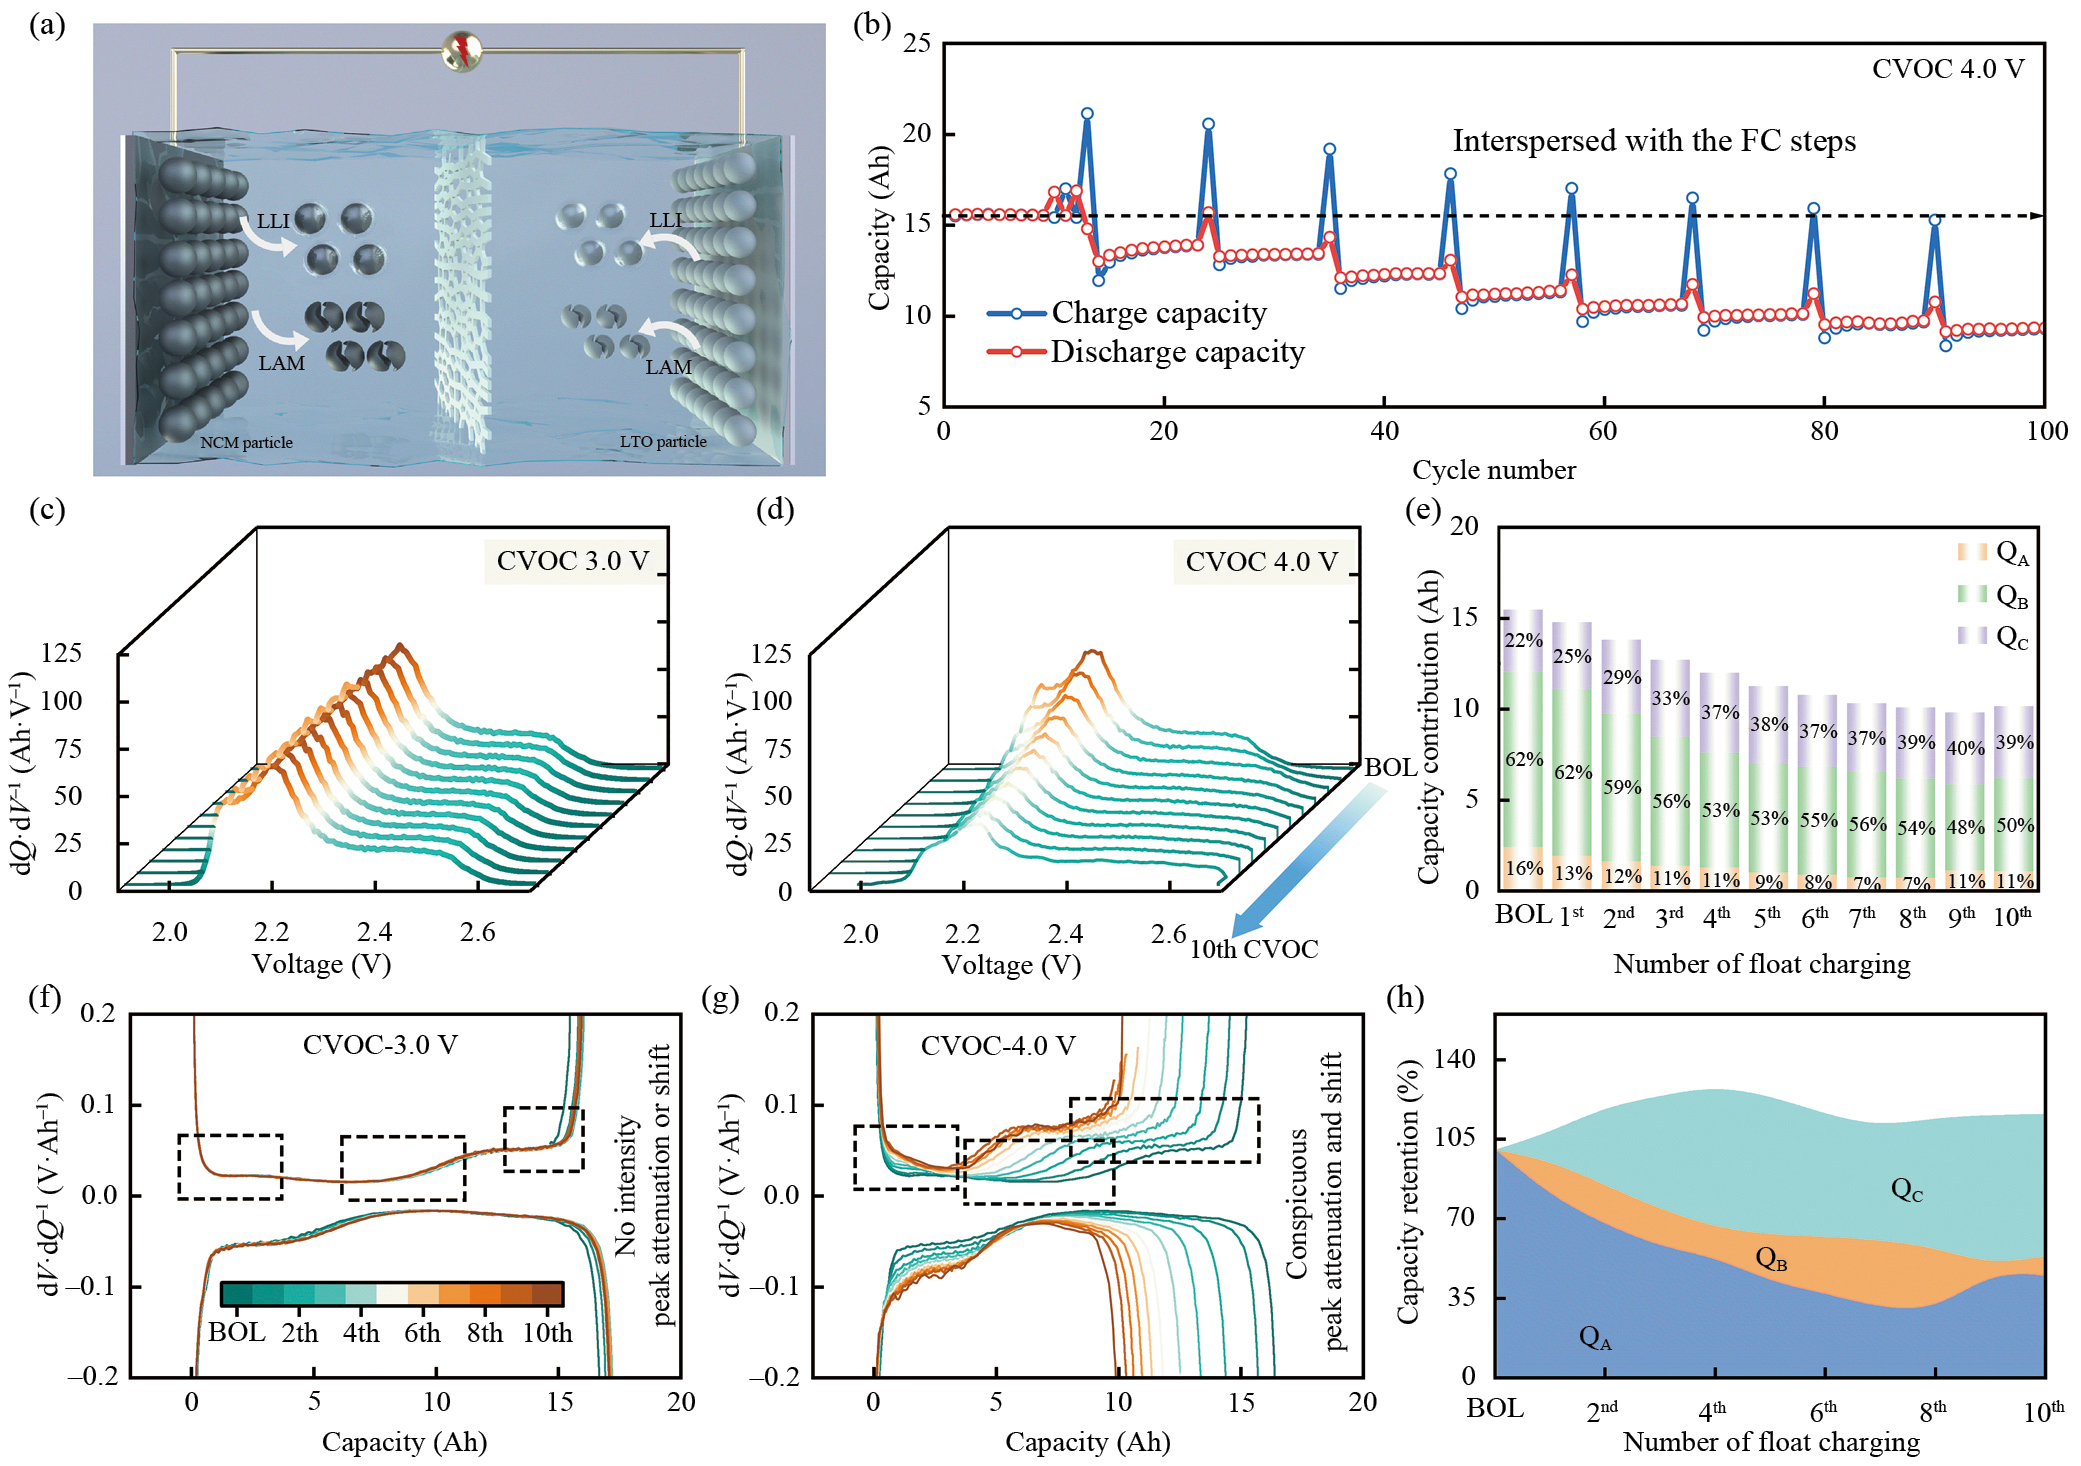
The hybrid pulse power characterization (HPPC) test has been extensively employed to assess this characteristic in LIBs. The HPPC protocol comprises three sequential stages: (1) a 10-s constant current discharge at a 1C rate, (2) a 40-s open-circuit rest period, and (3) a final 10-second constant current charge at a 0.75C rate. HPPC tests are conducted to evaluate the internal resistance of the battery at a 100% SOC. The internal resistance is calculated via Eq. (1), where ΔV represents the voltage variation and I denote the charging current.(1)Incremental capacity analysis (dQ·dV−1) and differential voltage analysis (dV·dQ−1) are widely employed to identify electrochemical plateaus accurately and elucidate the underlying degradation mechanisms in lithium-ion batteries. Three primary mechanisms responsible for capacity fade have been established: lithium inventory loss (LLI), loss of active material (LAM), and increased ohmic resistance (ORI) (Fig. 1(a))[16]. Accordingly, the quantification of these degradation mechanisms was investigated via the dQ·dV−1 and dV·dQ−1 methods.
Electrochemical impedance spectroscopy (EIS) was performed over a frequency range of 100 kHz to 0.01 Hz with a perturbation amplitude of 5 mV. Measurements were acquired and modeled via a VMP3 potentiostat (BioLogic, Inc.) integrated with EC-Lab software.
Accelerating rate calorimetry (ARC) experiments are conducted via an EV+ system (Thermal Hazard Technology, THT) following the standard heat-wait-seek protocol. In this procedure, the ARC system increases the cell temperature in 5 °C increments until significant self-heating is detected, defined as a temperature rise rate of 0.02 °C·min−1. Each temperature step was subsequently held for 60 minutes to ensure thermal equilibration within the cells.
X-ray diffraction (XRD) measurements were carried out via a Rigaku SmartLab SE diffractometer with Cu Kα radiation (λ = 0.154059 nm) operated at 40 kV and 40 mA with a step size of 0.01° and a scan rate of 2°·min⁻¹. The electrode morphology was examined by scanning electron microscopy (SEM, FEI Scios 2 HiVac). X-ray photoelectron spectroscopy (XPS) was performed on a Thermo Scientific K-Alpha Plus instrument equipped with a monochromatic Al Kα X-ray source (1486.6 eV) operated at 12 keV and 6 mA. Survey and high-resolution spectra were acquired at pass energies of 200 eV and 50 eV, respectively, with all binding energies calibrated against the C 1s peak of amorphous carbon at 284.8 eV.
The thermal gravimetric analysis (TGA) measurements were carried out at a heating rate of 1 ℃·min−1 using the Mettler Toledo Inc., model DSC 3+ device.
The capacity effect induced by CVOC was systematically investigated under a series of constant voltages (2.7, 3.0, 3.3, 3.5, 3.7, 4.0, 4.3, 4.5, and 5.0 V) following ten normalized charge–discharge cycles to identify the inflection point voltages of the CVOC. The key experimental parameters are summarized in Table S2. As shown in Fig. S3, the voltage profiles of the LTO/NCM cell at room temperature (RT) exhibit a typical operating voltage of ~2.0 V with a cutoff voltage of 2.7 V under routine charge–discharge conditions. At overcharge voltages below 3.5 V, both the discharge and charge curves maintain similar shapes. During CVOC, however, the cell voltage does not reach the target value immediately but instead increases gradually, particularly when the constant voltage exceeds 3.5 V. Correspondingly, an additional discharge plateau appears during the subsequent discharge. This phenomenon is attributed to excessive lithium intercalation into the cathode and excessive lithium deintercalation from the anode.
Notably, anomalous electrochemical behavior becomes prominent at higher voltages. Although the maximum discharge capacity is obtained at 4.0 V, further increases in voltage result in marked capacity degradation. For example, under CVOC at 4.3 V, the discharge capacity decreases to 15.54 Ah (75.37% of the overcharged capacity) and further decreases to 10.16 Ah at 4.5 V (57.57%). These results indicate that as overcharging progresses, irreversible reactions occur within the battery. These processes are generally attributed to electrolyte decomposition at elevated voltages and subsequent reactions between decomposition byproducts and the electrodes [17, 18]. Two charge–discharge modes were investigated to assess their impact on cycle performance: CVOC and NC. In overcharge mode, the charged capacity increases with increasing voltage, reaching 16.15, 16.36, 16.67, 16.88, 18.51, 20.63, and 17.66 Ah at 3.0, 3.3, 3.5, 3.7, 4.0, 4.3, and 4.5 V, respectively. As illustrated in Fig, S4, the charging capacity correlates positively with the applied constant voltage within a 1 h period. However, a critical threshold emerges at 3.5 V, beyond which the discharge capacity during subsequent normal cycles decreases.
Figure S5 further highlights that the charge capacity does not increase significantly below 3.3 V. A distinct rise appears at 3.5 V but is accompanied by a noticeable decline in cycling stability: The capacity decreases from 16.03 to 15.66 Ah at 3.5 V and then further decreases to 15.10 Ah at 4.0 V and only 9.25 Ah at 4.3 V. These observations demonstrate that while additional charge can be introduced under high CVOC conditions, it cannot be fully released during discharge. This irreversible behavior implies that lithium ions are trapped during CVOC, leading to incomplete delithiation from the LTO anode, incomplete lithiation of the NCM cathode, and further depletion at high voltages [19, 20]. These irreversible changes indicate electrode or interfacial damage under high-voltage stress, even though LTO cells are generally regarded as highly safe. Collectively, these findings emphasize that voltage control is critical during battery grouping to define safe operating boundaries, with 3.5 V identified as the irreversible damage threshold for LTO cells. When the overcharge voltage is less than 3.5 V, no obvious capacity attenuation is observed in the battery. However, once the voltage rises to 3.5 V or above, the battery's capacity shows a significant decline. At 3.5 V CVOC, a large amount of capacity attenuation occurs in the battery during the first overcharge, and then tends to stabilize. This might be due to the decomposition of additive substances in the electrolyte, which are exhausted during the overcharge process. When the battery is overcharged at 4.0 V, its capacity continuously decreases as the overcharge proceeds, indicating that the main components in the electrolyte are constantly decomposing, and the generated products continuously combine with Li in the electrolyte to form by-products and deposit.
To investigate the effect of overcharging at various voltage levels on the aging behavior of LTO batteries, a series of overcharging cycles was conducted, followed by performance reference tests (Table S3). Three representative batteries were selected to examine the influence of CVOC on performance: a normal cycle and cells overcharged at 3.0 V (CVOC 3.0 V), 3.5 V (CVOC 3.5 V), and 4.0 V (CVOC 4.0 V). The impact of the overcharge voltage on capacity degradation is shown in Figs. 1(b) and S6. For NC and CVOC at 3.0 V, the discharge capacity after 100 cycles (matched to the number of cycles in the overcharged cells) remained comparable to the initial value (as normalized in the inset). In contrast, at 3.5 V, a critical turning point, pronounced capacity decay was observed: The discharge capacity decreased from 15.86 to 13.86 Ah (89% retention) after only 10 CVOC cycles. Moreover, the accelerated degradation of CVOC was accompanied by gas generation and noticeable cell swelling. At 4.0 V, the degradation was more severe: After the 10th overcharge, the discharge capacity further declined, with only 9.37 Ah (60% retention) remaining by the end of the capacity performance tests, underscoring the irreversible damage induced by the CVOC in LTO batteries.
Figure S7(a) shows the incremental capacity (IC) curve, whereas Fig. S7(b) presents the corresponding differential voltage (DV) curve. Each peak on the IC curve aligns with a plateau in the voltage profile, reflecting a distinct phase transition of the active material. Peaks I, II, and III, located at 2.10, 2.19, and 2.43 V, respectively, correspond to the voltage plateaus depicted in Fig. S7(b). The anode serves as a reference electrode because of the stable voltage behavior exhibited by the LTO battery in the two-phase transformation region. Consequently, the peaks in the IC curves can be attributed exclusively to the cathode, with each peak representing a phase equilibrium of the NCM cathode material [21].
IC analysis is widely employed to investigate electrode and battery electrochemistry, as it is defined by the derivative of discharged capacity with respect to voltage (dQ·dV−1) [22]. As illustrated by the evolution of the IC curves (Figs. 1(c, d), and S7(d)), the charging process was analyzed to gain insights into the degradation mechanisms. At 3.0 V, the curves of the overcharged cell show only subtle changes compared with those of normally charged and aged cells. However, when the voltage increases to 3.5 V, the intensities of the three peaks decrease after the second CVOC cycle, particularly for Peak III. At even higher voltages (Fig. S7(c)), the peaks shift significantly toward higher potentials with increasing overcharge cycles. This phenomenon is attributed to capacity decay arising from irreversible lithium-ion transitions. In the 2.37 V–2.63 V range, CVOC-aged cells, particularly those charged at 4.0 V, exhibit a rightward shift and a flattening of Peak III, with an approximate change of 30 Ah·V−1. This shift is consistent with the degradation of the layered NCM structure, as reported in our previous work [23].
To further probe the aging mechanism, DV analysis was performed at a low current rate 0.1C. Introduced by Bloom et al. [24], the dV·dQ−1 approach enables quantitative separation of degradation contributions, including LLI from SEI growth at the negative electrode and LAM from either the positive or negative electrode [25].
Figure 1(e) presents the contributions of QA, QB, and QC across CVOC cycles. At the onset of the test, QB contributes the majority of the capacity (62%), whereas QA and QC contribute 16% and 22%, respectively. Throughout testing, QC remains stable, whereas QA and QB undergo marked degradation, as shown in the histogram of capacity contributions. A consistent trend across all the plots is that with decreasing capacity, the peaks shift to lower voltages (Figs. 1(f, g) and S7(d)). This leftward shift is a hallmark of aging and is associated with reduced capacity utilization [24]. To differentiate the contributions of various degradation modes, prior work has suggested segmenting the DV curve into distinct regions [5]. For cells overcharged to 4.0 V, three plateau regions (PA, PB, and PC) are observed, delineated by dashed lines, with corresponding capacities of QA, QB, and QC (Fig. S7(b)). Capacity changes in QA and QC reflect the combined effects of LAMcat, LAMan, and LLI, whereas QB is solely associated with LAMcat (Fig. 1(a)) [5]. The PC region emerges only after aging. As noted earlier, the anode exhibits a constant voltage plateau during the two-phase transformation; thus, the PB and PC phase transitions originate from the cathode (LiCoO2). Figure 1(h) further highlights the retention behavior of QA, QB, and QC. With increasing CVOC cycles, QA and QB dominate the capacity fading process, whereas QC remains largely unaffected. These findings reveal that overcharging induces coupled degradation of both the cathode and anode in LTO/NCM cells, involving LAMcat/an and LLI. At extreme states of lithiation (both low and high), irreversible reactions are exacerbated owing to hindered lithium intercalation and deintercalation, ultimately resulting in irreversible capacity loss.
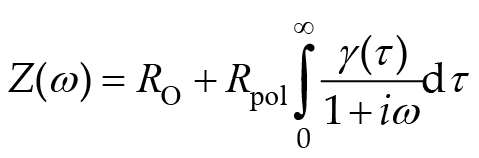
To investigate the mechanism of kinetic degradation during overcharging, we conducted an electrochemical impedance spectroscopy analysis on the overcharged battery at a voltage of 4.0 V. As shown in Figs. 2(a) and S8(a), the resistance related to the film interface tends to decrease as the number of cycles increases [26–28]. However, at a high overcharge voltage of 4.0 V, the value increases in the last few cycles. This abnormal phenomenon results in severe damage to the film interface. Besides, EIS tests are conducted on LTO battery cycled at NC condition. As shown in Fig. S9, the Nyquist plots of the battery before and after 100 cycles reveal the impedance changes of the LTO battery before and after cycling. After equivalent circuit fitting, the film resistance (Rf) of the battery remains basically unchanged, from the initial 0.47 to 0.57 mΩ. The charge transfer resistance (Rct) part shows a slight decrease, from 35.27 mΩ before cycling to 23.94 mΩ after cycling. The material of the battery is activated after short-term regular CCCV cycling. This is also consistent with the impedance change trend under low overcharge voltage. For deeper study, the polarization processes are characterized by the peaks in the γ(τ) vs. τ curve, which are calculated via the distribution of relaxation times (DRTs) method [29]. The relationship between the impedance and its DRTs is [30]:(2)with the boundary condition:(3)where Z(ω) represents the impedance data, the ohmic resistance is denoted by RO, and the overall polarization resistance is represented by Rpol. γ (τ) is DRT, and the time constant τ = RC. The term signifies the proportion of the total polarization resistance that corresponds to relaxation times falling within the range from τ to τ+dτ. By plotting γ(τ) versus τ, polarization processes associated with different time constants can be distinguished, and the peak area is proportional to the magnitude of these polarization processes. Moreover, by employing a plot of the polarization resistance as a function of the SOC, the polarization processes characterized by distinct time constants can be resolved, and the area under each peak corresponds to the magnitude of the respective polarization process.
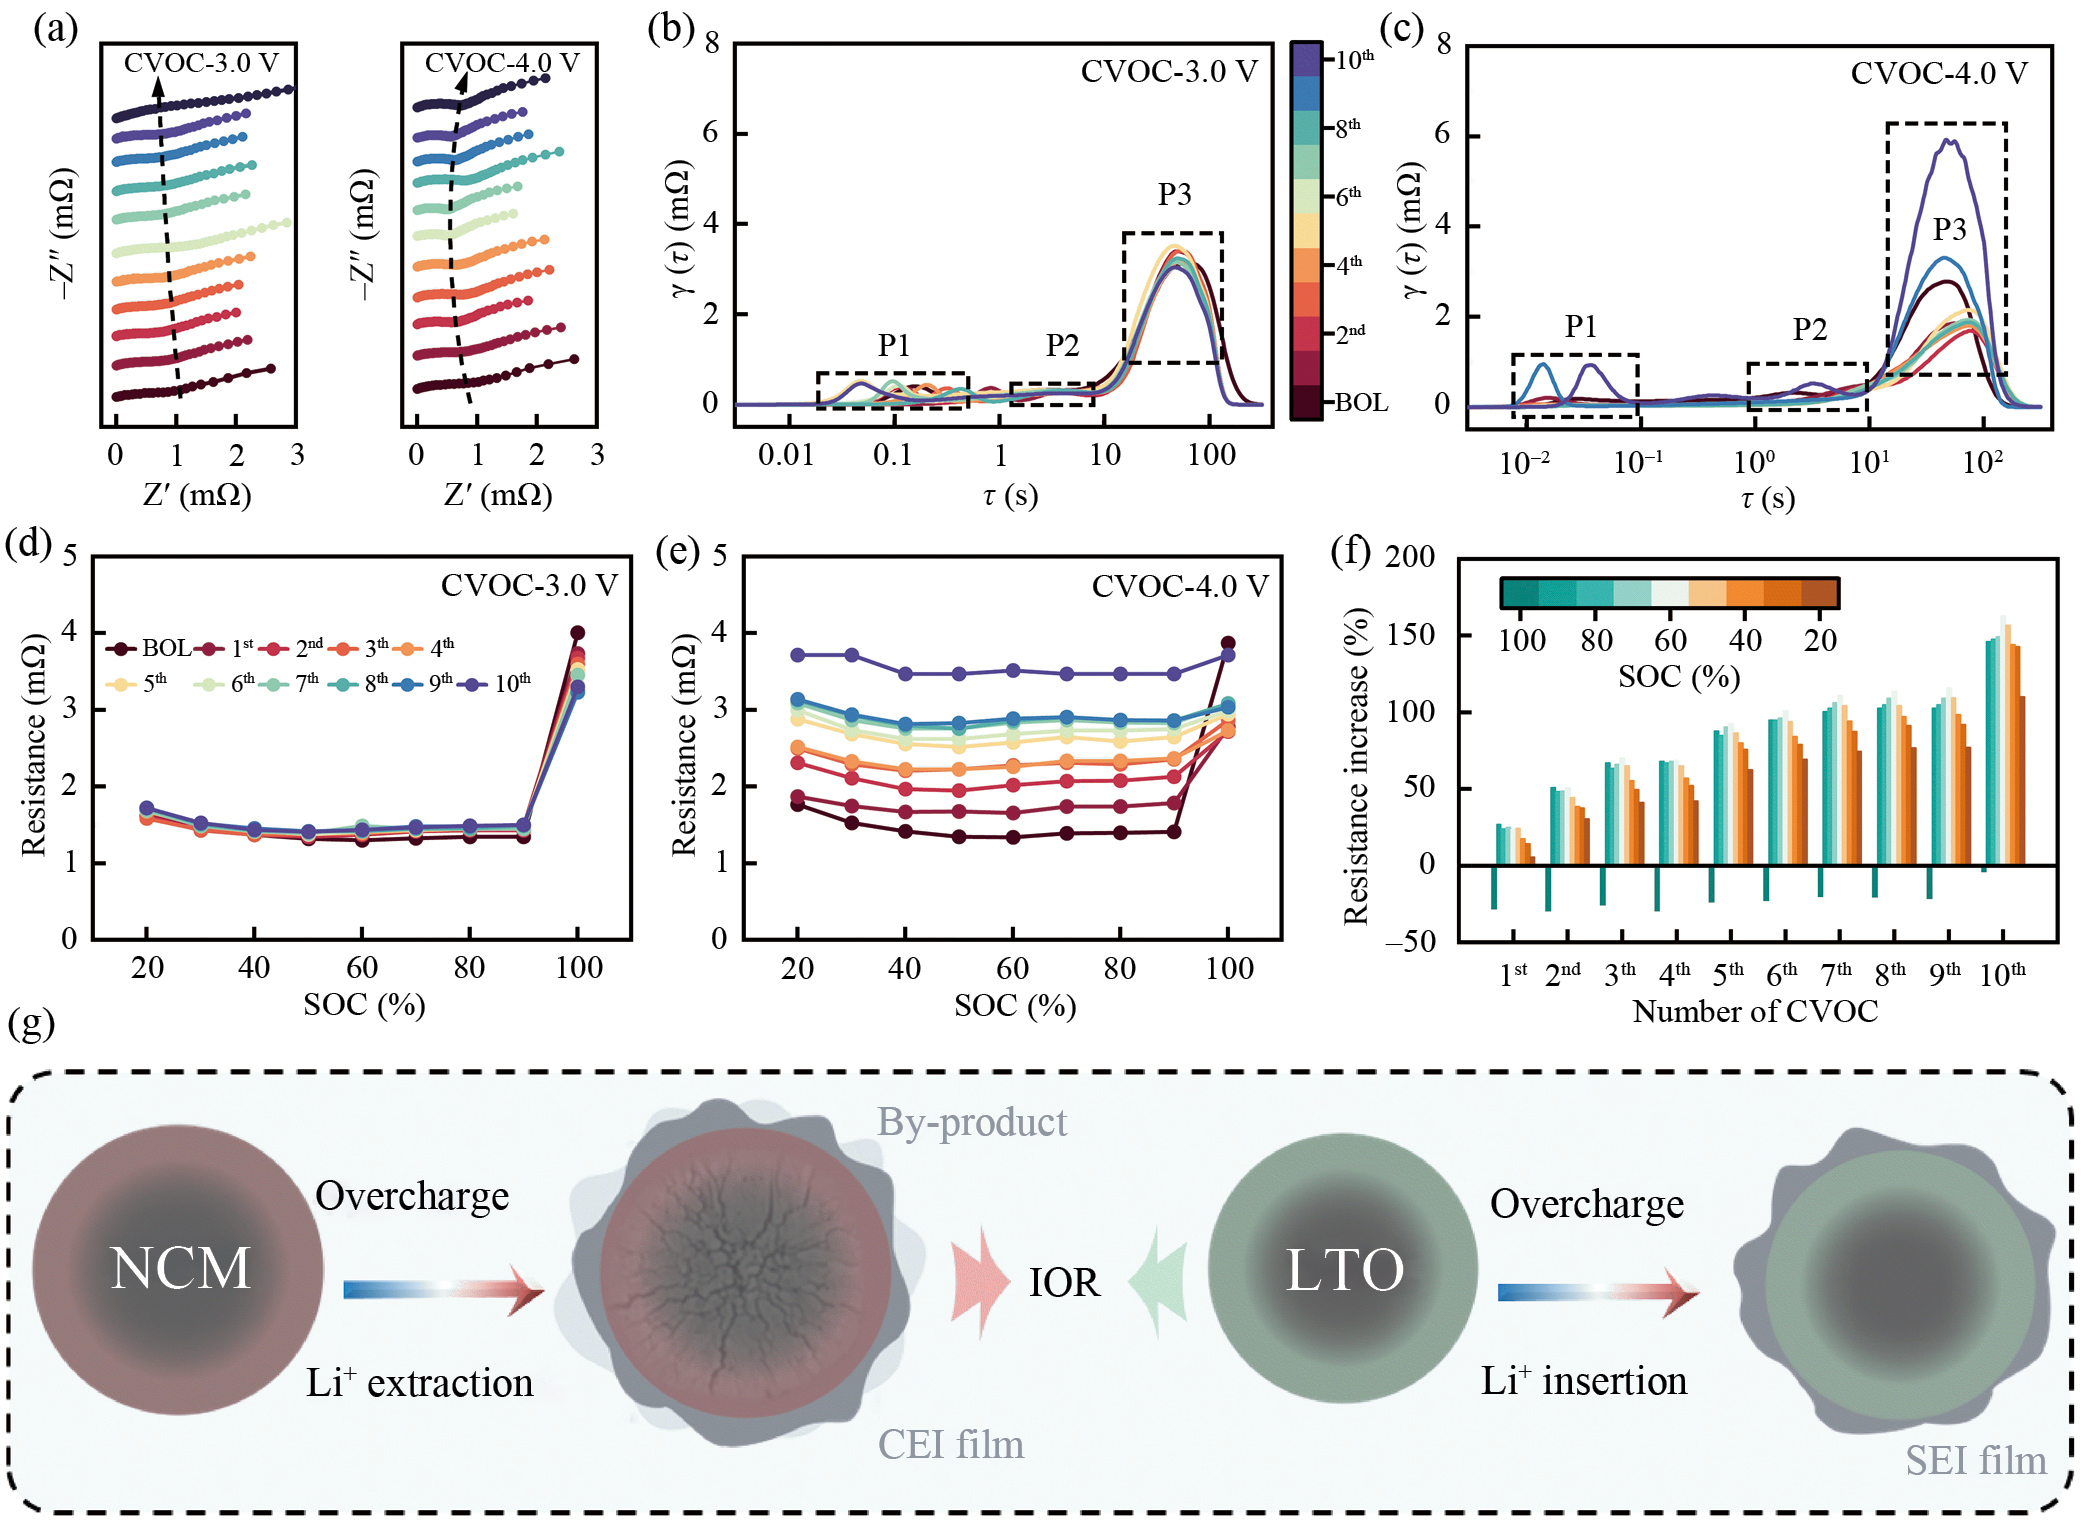
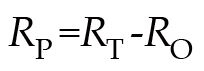
For comparison, EIS curves are horizontally offset (note that the deconvolution results for DRT analyses are based on the original data). The experimental frequency range spans from 0.01 Hz to 100 kHz, corresponding to a time domain of 10−2–102 s; therefore, DRT values outside this interval are considered unreliable and excluded from analysis. In the EIS spectra, two semicircular features appear in the intermediate frequency region, with no diffusion-related profile observed. The corresponding DRT distribution reveals three distinct peaks, labeled P1 to P3, in ascending order of time constants. As the time constant increases, the DRT peaks represent various electrochemical processes, including contact impedance, lithium-ion transport at the SEI/CEI interface, charge transfer, and diffusion [26, 27, 31]. As shown in Figs. 2(b, c) and S8(b), the three peaks can be assigned to contact impedance (P1), lithium-ion transport across the SEI/CEI interface (P2), and the charge-transfer process on the NCM cathode and LTO anode (P3), which is consistent with prior reports [8, 32]. The P1 peaks exhibit irregular variations across all the cells, which likely originate from contact resistance errors during testing. For P2, negligible changes are detected at an overcharge voltage of 3.0 V; however, at higher voltages, the peaks shift to longer time constants, particularly at 4.0 V, indicating a weakened lithium-ion transport process at the SEI/CEI after overcharging. The evolution of P3 strongly depends on the overcharge voltage. At lower voltages, only subtle changes are observed (Fig. 2(b)). At 3.5 V, the peak intensity gradually increases with CVOC cycling, whereas at 4.0 V (Fig. 2(c)), the peak intensity increases markedly, suggesting that high-voltage overcharging hinders the charge-transfer process and induces progressive degradation during cycling. Collectively, these results demonstrate the detrimental impact of high-voltage overcharging on lithium-ion transport across the SEI/CEI interface and on charge-transfer kinetics. The relative increase in direct current internal resistance (DCIR) as a function of SOC for cells subjected to different overcharge aging conditions is shown in Fig. 2(d, e). DCIR evolution was evaluated via HPPC tests, which probe battery internal resistance at various SOCs. During HPPC, a sequence of power pulses is applied to the fully charged cell: (1) 1C discharge for 10 s, (2) rest for 40 s, and (3) 0.75C charge for 10 s (Fig. S10(a)). This method allows the assessment of total resistance (RT), ohmic resistance (RO), and polarization resistance (RP) under different overcharge conditions. In the first cycle, the RT values were similar among the cells, ranging from 1.36 to 1.75 mΩ in the 20%–90% SOC range and ~4.00 mΩ at 100% SOC. As shown in Fig. 2(d), the cells cycled at a CVOC of 3.0 V presented similar resistance profiles. In contrast, high-voltage overcharging caused the internal resistance to increase by >160% (Fig. 2(e)). The histogram in Fig. 2(f) further shows that resistance growth is most pronounced at 80% SOC, whereas the increase is minimal at 100% SOC. Before reaching 80% capacity, the internal resistance increases progressively, likely influenced by the voltage plateau. During charging, the DCIR increases with the SOC, especially in the 50%–70% range, corresponding to a voltage plateau between 2.15 and 2.4 V. A similar trend is observed during regenerative charging (Fig. S11). Finally, RT, RO, and RP were calculated according to Eqs. (4)–(6), which represent the total, ohmic, and polarization resistances, respectively.(4)(5)(6)
The curves for the ohmic and polarization resistance are shown in Figs. S10 and 11. Compared with the modest increase in the ohmic resistance observed during the 3.0 V overcharging process, a more pronounced increase is observed. With respect to the polarization resistance, minimal changes (<1 mΩ) are observed across all three cases. Overall, these alterations contribute to the degradation of the electrochemical properties. Furthermore, the increase in these internal resistances is attributed to battery aging phenomena such as the deposition of byproducts with poor electrical conductivity and the degradation of the electrode materials, as described in Fig. 2(d).
Postmortem analysis, which involves disassembling cells to examine the internal condition of their components, is a critical approach for elucidating degradation mechanisms. In this study, two types of cells were disassembled and compared. The first corresponds to a normally charged battery cycled under standard constant-current/constant-voltage (CC–CV) charging conditions. To investigate the effect of high-voltage overcharging, a second set of cells that underwent significant degradation after extensive durability testing at 4.0 V were analyzed. For consistency, both cell lines were subjected to 100 cycles. Scanning electron microscopy (SEM) images of the normally charged and overcharged cells are shown in Fig. 3. The positive electrode particles are generally ~5 μm in size. In the overcharged cells, fractured cathode particles are clearly observed (Fig. 3(a, b)), whereas relatively intact secondary particles with well-defined boundaries remain in the normally charged cells. These results indicate severe structural damage to the cathode upon overcharging. The negative electrode consists of LTO with two-dimensional conductive additives, as shown in Fig 3 (c, d). On the aged LTO anode, nonnegligible side products are observed, which significantly increase the interfacial resistance. In contrast, electrodes from a normally charged cell retain clearer morphologies. However, for the overcharged cell, large portions of the LTO layer peeled away from the current collector, further demonstrating extreme deterioration of the electrode surface. These results explain the swelling observed in aged cells and the performance decay induced by side reactions during high-voltage overcharging. Cross-sectional views of the electrodes after 100 cycles are shown in Fig. 3(e, g, i, k). A greater degree of particle fracture is observed in the NCM cathode after 4.0 V overcharge than during normal cycling. Consistent with the optical images, the LTO anode in the overcharged cell readily detaches from the aluminum current collector during cutting, with fallen active material clearly visible in the cross section. This behavior arises from continuous side reactions during overcharging, leading to repeated SEI film formation and thickening, which reduces electrode flexibility [33]. Enlarged cross-sectional views reveal that the LTO anode from the normally charged cell maintains clear particle outlines without interfacial films. In contrast, the LTO anode subjected to 4.0 V overcharge exhibited pronounced interfacial structures covering the particles, confirming the presence of a thickened SEI membrane.
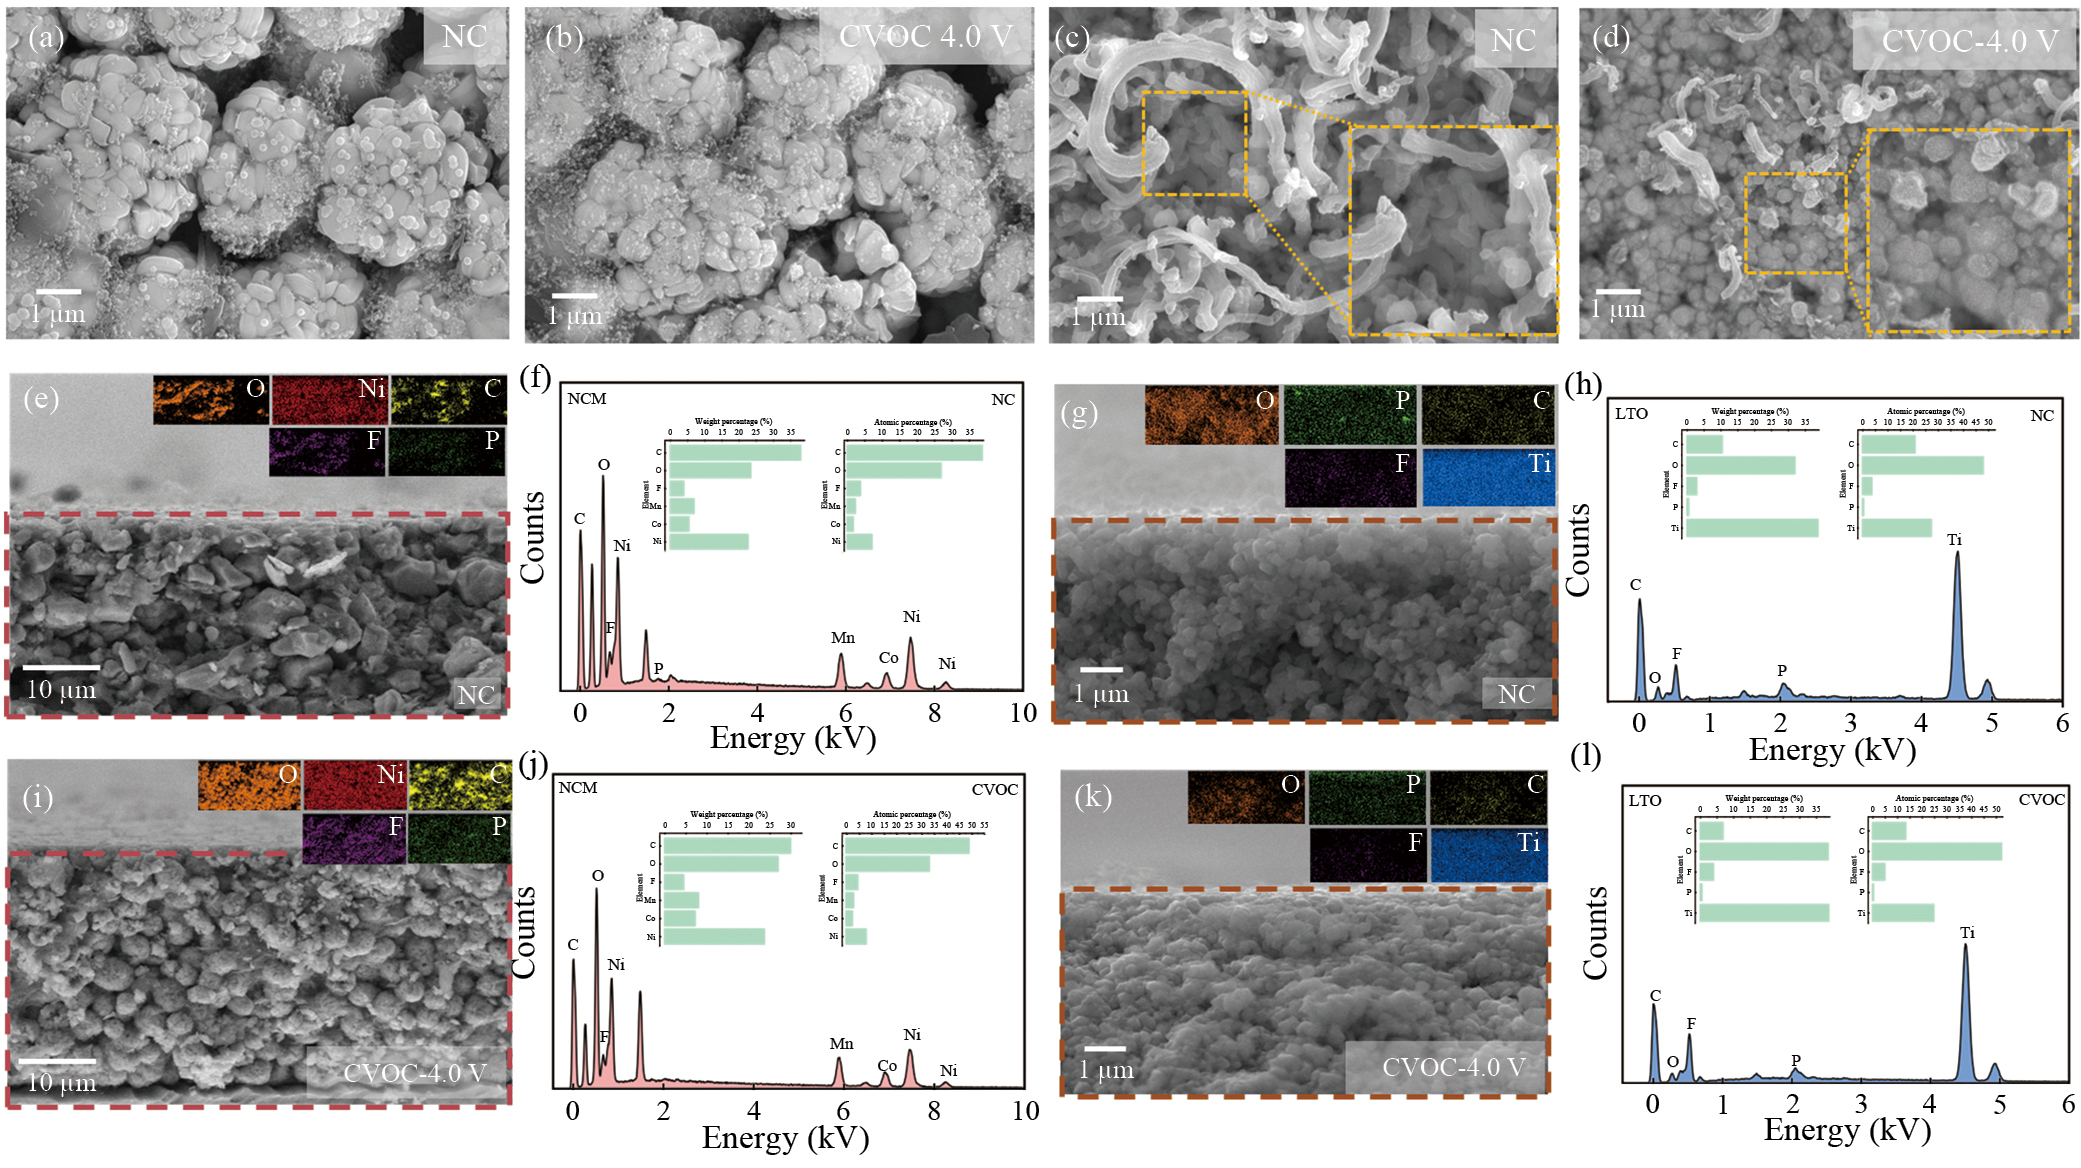
To characterize the elemental distributions at the electrode interfaces further, anodes from normally charged and overcharged cells were examined via linear-scan energy-dispersive X-ray spectroscopy (EDS). The results are shown in the inset figures. For the NCM cathode, EDS mapping indicates increased intensity of O, Ni, C, F, and P elements after overcharging, whereas the LTO anode shows decreased intensity of O, F, Ti, and C. These trends suggest substantial chemical and structural modifications in both electrodes during overcharging. For the NCM cathode (Fig. 3(f, j)), the increase in O and Ni intensities indicates surface reconstruction and metal dissolution. Concurrently, decomposition of the electrolyte produces fluorine- and phosphorus-containing byproducts, which accumulate on the cathode surface, explaining the increased F and P signals. For the LTO anode (Fig. 3(h, l)), the decreased O, F, Ti, and C signals reflect extensive SEI formation during overcharging. The growth of this interfacial layer consumes electrolyte and lithium ions, whereas changes in the SEI composition reduce the F content and enrich the C species. These processes promote gas evolution and deteriorate the thermal stability of the battery.
The pronounced degradation of the NCM cathode in LTO batteries is clearly evidenced by XRD analysis. The diffraction peaks of the NCM cathode (Fig. S14(a)) can be indexed to the hexagonal lithium nickel oxide structure (JCPDS 85-1986). A sensitive indicator of Li/Ni intermixing is the intensity ratio of the (003)/(104) reflections, where a ratio below 1.2 indicates a high degree of cation mixing [34, 35]. As shown in Fig. S14(b), the I003/I104 ratio of the lithium titanate battery decreases from 1.98 to 1.48 after overcharge cycling, reflecting aggravated Li/Ni intermixing. Overall, these results suggest that degradation primarily occurs in the NCM material, which hinders bulk phase transformation within the structure. The XRD patterns of the LTO anode under normal charging and overcharging are shown in Fig. S15. All the reflections can be assigned to spinel-type LTO with the space group (JCPDS 49-0207). Compared with the normally charged sample, no significant peak shifts or new peaks are detected after overcharging. The absence of additional reflections, particularly near 40°, indicates preservation of the structural integrity of the anode.
To further probe the surface oxidation states, XPS measurements were performed. The C 1s binding energy at 284.8 eV was used as the calibration reference. Electrodes were harvested from cells subjected to different aging protocols. For the LTO anode, the C 1s, O 1s, F 1s, and Ti 2p spectra are shown in Fig. 4. The C 1 s spectrum (Fig. 4(a)) is deconvoluted into four components: C-C/C-H (284.5 eV), ROLi (285.6 eV), C=O (288.5 eV), and ROCO2Li (289.9 eV) [36]. Notably, the intensity of the C=O peak decreases significantly in the overcharged sample (2479.79 CPS) compared with the normally charged sample (2714.18 CPS). The O 1 s spectra (Fig. 4(b)) show two dominant peaks corresponding to ROCO2Li and Li2CO3, along with a weaker O2− contribution; no significant variation is observed between samples, indicating that the surface oxygen environment of the LTO anode is largely preserved during overcharging [37]. High-resolution F 1 s spectra (Fig. 4(c)) reveal two distinct components attributable to LixPOyFz and LiF. A weakened LiF signal is detected in the overcharged sample, suggesting destabilization of the SEI, where LiF is a key constituent [38]. These findings point to the formation of a thicker SEI layer, arising from parasitic reactions during overcharging. The Ti 2p spectra are presented in Fig. 4(d). For comparison, the Ti 2p3/2 peaks are highlighted with hollow dots. An increased Ti3+ signal is observed in the overcharged electrode, indicating partial reduction and damage to the lithium titanate anode.
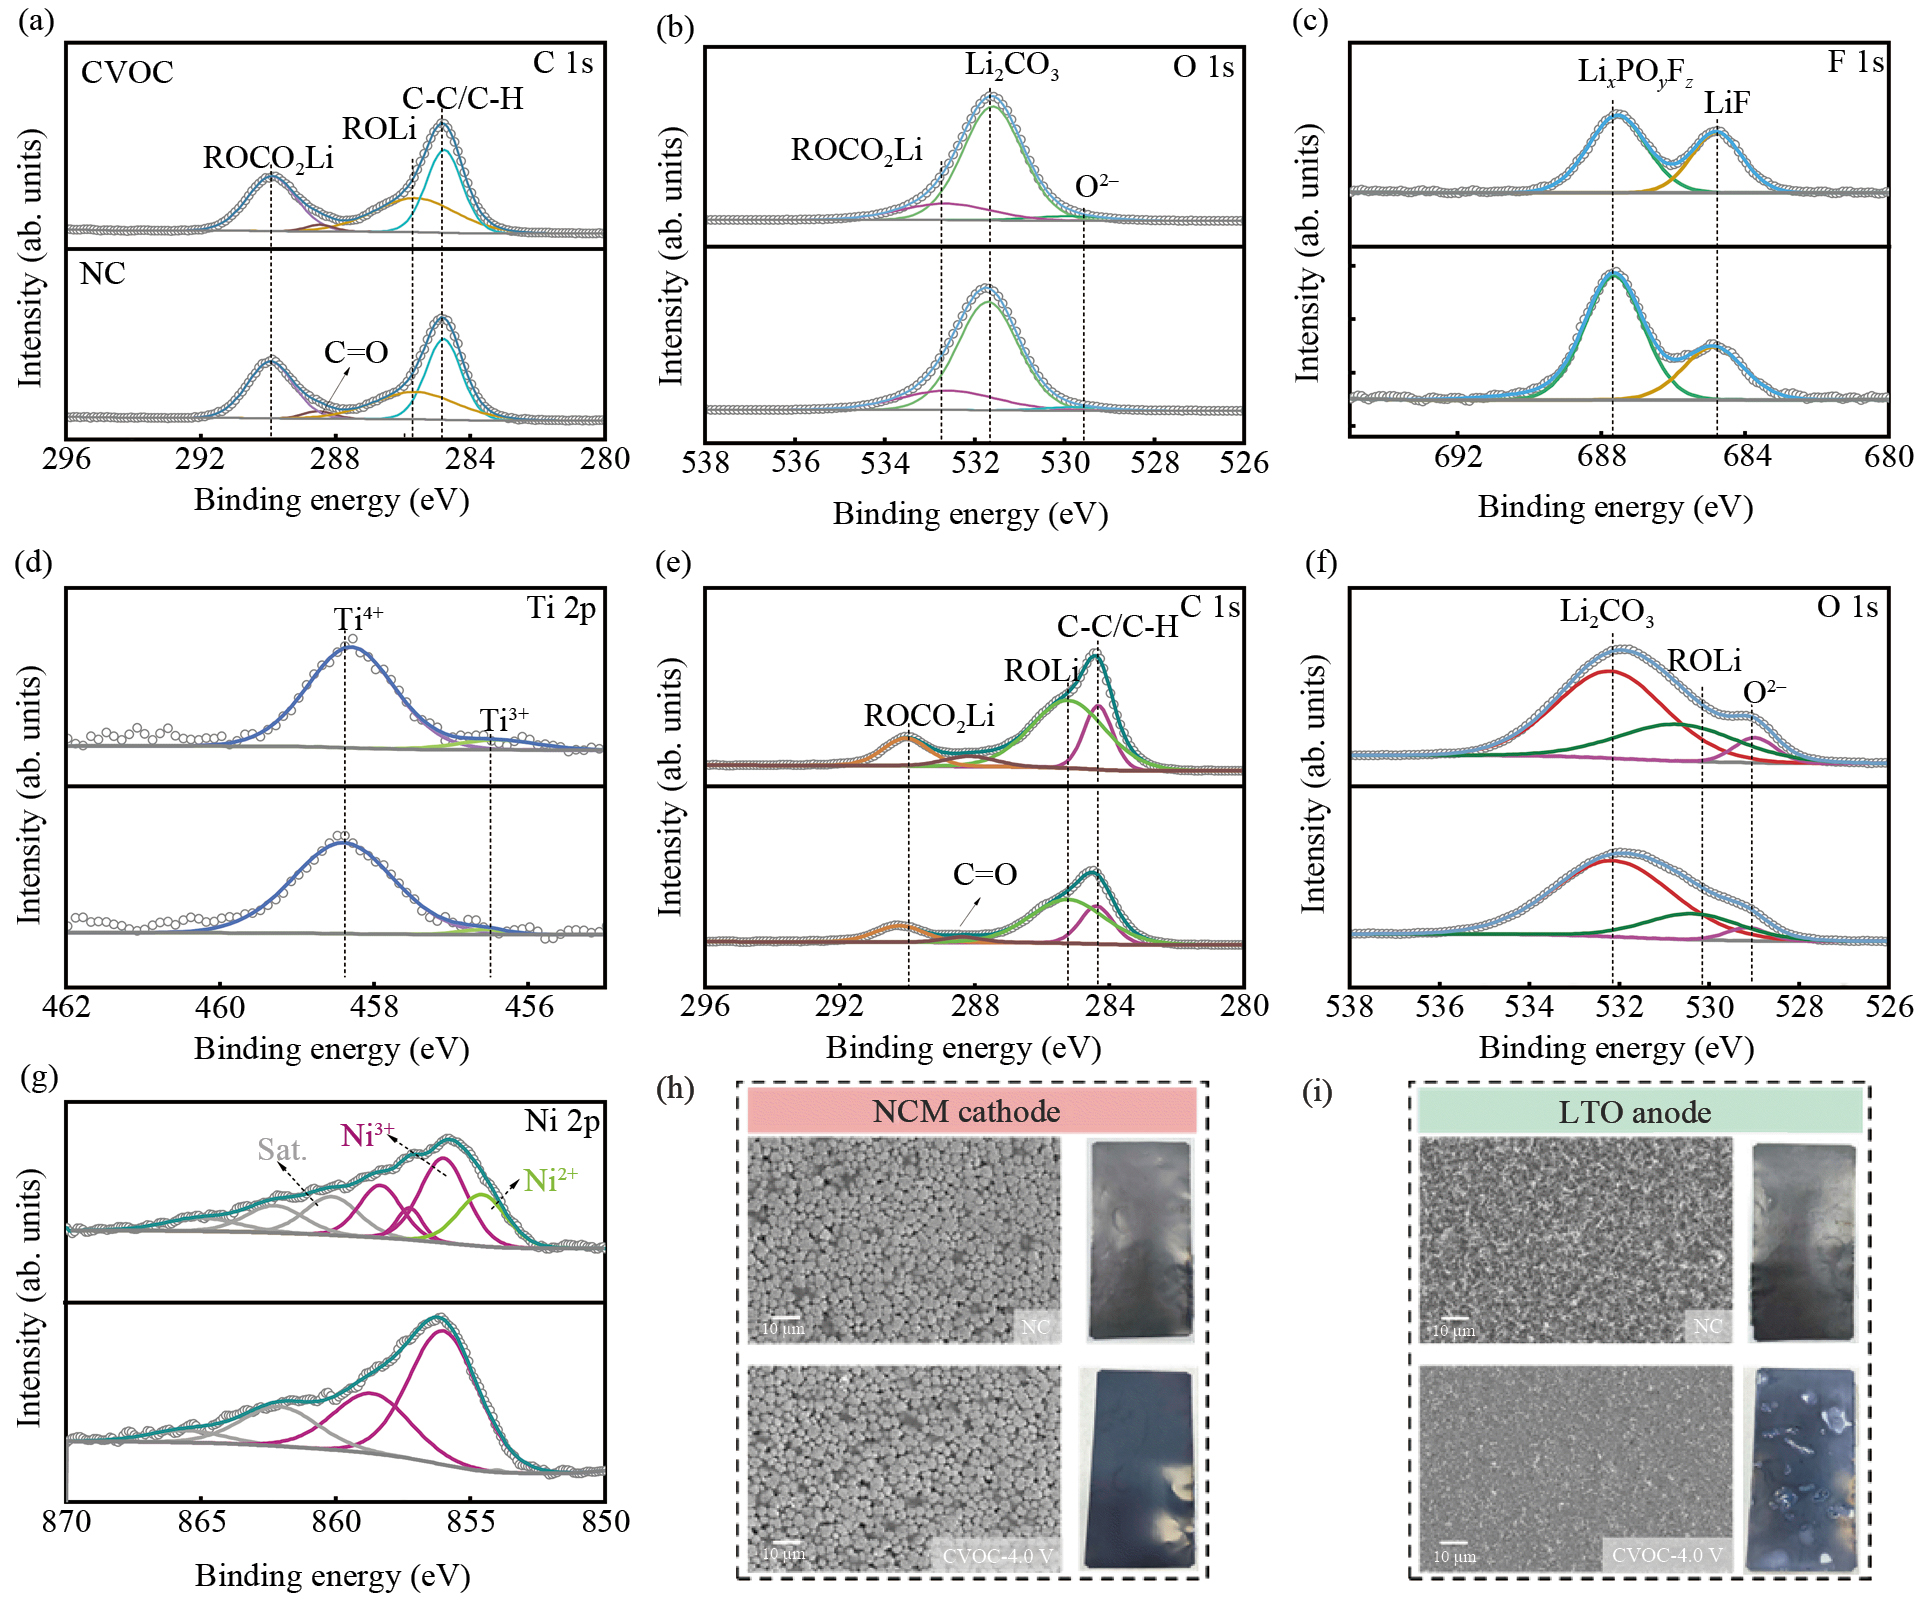
A comparative XPS study of NCM cathodes aged under different conditions (NC and CVOC of 4.0 V) was also carried out. In the C 1s spectrum, the ROLi component intensifies, reflecting surface/interface degradation under high-voltage overcharge. The O 1s spectra reveal peaks assigned to lattice O2− (~529 eV), ROLi (~530 eV), and Li2CO3 (~532 eV). As shown in Fig. 4(f), the lattice O2− peak is more intense in the overcharged cathode than in the normally charged cathode. This is attributed to surface oxygen passivation by reducing the amount of gases (e.g., H2) generated during high-voltage overcharging, which leads to an increase in the O2− binding energy. In the F 1s spectra (Fig. 4(g)), two prominent features corresponding to LiF and LixPFyOz are observed. The LixPFyOz signal is markedly enhanced after overcharging, indicating the formation of a thicker, more organic-rich cathode electrolyte interphase.
The Ni 2p spectra were further analyzed to determine the transition metal states at the cathode surface. Figure 4(g) shows the Ni 2p3/2 spectra for the normally charged and overcharged samples. Two components corresponding to Ni3+ (856.1 eV) and Ni2+ (854.0 eV) are identified [39]. While Ni2+ is negligible under normal charging, a prominent Ni2+ signal is evident after overcharging, which is consistent with the XRD results and confirms significant degradation of the cathode.
Finally, SEM and digital images of the disassembled electrodes (Fig. 4(h, i)) revealed severe fragmentation of the cathode particles, along with the deposition of byproducts. Similar surface degradation is also observed on the LTO anode, indicating substantial alteration of the electrode/electrolyte interface under overcharging conditions.
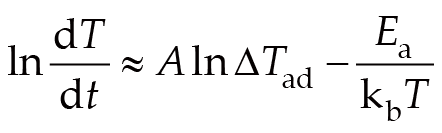
To gain deeper insight into the thermal runaway behavior induced by overcharge, ARC tests were conducted to evaluate the thermal safety of a fully charged 15 Ah LTO/NCM pouch cell via the heat-wait-search (HWS) protocol. Batteries subjected to conventional CCCV charging, as well as those overcharged at 3.0, 3.5, and 4.0 V, were assessed through multiple repeated tests for each condition. The results revealed consistent curve patterns across the samples. In the ARC analysis, three critical temperature thresholds were defined: T1, the onset temperature of self-heating (temperature rise rate > 0.02 °C·min−1); T2, the thermal runaway trigger temperature (temperature rise rate > 1 °C·min−1); and T3, the maximum temperature reached during thermal runaway [40]. The impact of CVOC behavior on the battery mainly lies in the battery interface, the structure of the cathode material, and the active Li sites. As these three mechanisms act on different structures of the battery, their influences on the battery's thermal runaway are manifested at different stages. The increase of organic matter at the interface weakens the battery's thermal stability, causing the interface film structure to undergo decomposition reactions at lower temperatures. Moreover, the loss of active Li in the cathode due to overcharging reduces the thermal reactivity of the Li-intercalated LTO with the electrolyte. Additionally, the fragmentation and collapse of the cathode structure caused by overcharging make it easier for oxygen to escape at high temperatures, intensifying the redox reactions among the components. Figure 5(a) compares the thermal runaway characteristics of normally charged cells with those of the overcharged cells. The T1 values of the overcharged samples decreased from 110.77 to 81.64, 81.84, and 66.00 °C for 3.0, 3.5, and 4.0 V overcharged samples, respectively, owing to catastrophic exothermic reactions between electrodes, reflecting decomposition of the SEI layer [41]. Interestingly, T2 increased with overcharge, which can be attributed to the presence of inactive lithium. A pronounced rise in T3 was observed for the overcharged cells (429.2, 445.5, 460.1, and 470.6 °C for NC, 3.0 , 3.5 , and 4.0 V overcharged batteries, respectively). This represents increases of 46.3, 30.9, and 41.4 °C above the NC T3 value (429.2 °C), suggesting more severe thermal release reactions and increasing safety concerns. The increase in T3 is attributed to electrode degradation under high-voltage overcharge conditions. Notably, despite the reduced discharge capacity following overcharging, intensified side reactions between the electrodes and electrolyte substantially compromise the safety performance [42]. Furthermore, the maximum temperature increase rate (dT·dtmax–1) increased from 52.45 °C·s−1 (NC) to 86.53 °C·s−1 (CVOC of 4.0 V), as shown in Fig. 5(b), indicating that exothermic reactions between the electrodes and electrolyte were strongly accelerated due to the instability of the SEI film under high-voltage overcharging. To further study the thermal runaway (TR) behavior after overcharged, time-scale analysis is conducted. Time parameters t1–3 respectively correspond to the occurrence times of T1–3 in TR. As shown in Fig. S16, with the overcharge voltage increases, the initial self-heating time t1 of the lithium titanate battery advances from 48,908.6 seconds during constant current charging to 13,442 seconds at 4.0 V CVOC. After overcharging, the interface structure of the battery deteriorates, and unstable electrolyte decomposition products deposit on the electrode surface, causing the self-heating temperature to decrease and the corresponding time to shorten. Interestingly, the onset time of thermal runaway t2 and the thermal runaway time t3 exhibit the same trend of change. Both t2 and t3 are delayed after overcharging, indicating that the internal thermal reaction slows down during the thermal runaway process in the overcharged and aged battery. The loss of active material slows down the internal thermal reaction kinetics and prolongs the time for thermal runaway to occur. To further elucidate the decomposition mechanisms during thermal runaway, the Arrhenius equation was applied to investigate the relationship between the temperature and self-heating rate, enabling a deeper understanding of the exothermic pathways involved. The simulation equation is given in Eq. (7).(7)where dT·dt−1 denotes the self-heating rate (SHR), ΔTad refers to the adiabatic temperature increase, A represents the frequency factor in the Arrhenius equation, kb represents Boltzmann's constant (1.380649 × 10⁻²³ J·K−1), and Ea represents the activation energy barrier.

The activation energy barriers were derived from the equation describing the variation in the occurrence of exothermic reactions. The simulation results for normally charged and overcharged batteries are presented in Fig. 5. The simulations were conducted only at temperatures where T1 >T3. As shown in Fig. 5(c–f), the relationships between ln (dT·dt−1) and 1000·T−1 are not strictly linear within the range of T1–T3, suggesting that multiple decomposition mechanisms contribute to the observed exothermic reactions under identical conditions. Notably, the voltage curve of the battery subjected to 4.0 V overcharge exhibited the most linear behavior within this range. Overall, the LTO battery under overcharging demonstrates inferior thermal stability, as evidenced in Fig. 5(g). It is anticipated that severe aging mechanisms, such as LAM, ORI, and LLI, produce similar exothermic reactions within this range, leading to greater heat accumulation [43].
On the basis of these simulations, the activation energy (Ea) of the battery under different charging conditions is summarized in Fig. 5(h). For a normally charged battery, the activation barrier is 2.37 eV. In contrast, the Ea values of overcharged batteries range from 0.85 to 2.46 eV, showing an overall downward trend. Specifically, a battery overcharged at 4.0 V exhibited an activation energy of ~1.16 eV, indicative of enhanced thermal reactivity following overcharging. This finding suggests that exothermic reactions are more likely to occur in aged batteries. The bar chart further reveals a consistent correlation between Ea and the frequency factor A. Batteries with higher activation energies also exhibit larger frequency factors, whereas lower Ea values are more prevalent in aged cells. Interestingly, cells subjected to 3.5 V overcharge display activation energies and frequency factors nearly identical to those of fresh cells, suggesting a more complex failure mechanism. In contrast, cells aged under 4.0 V overcharge highlight the substantial impact of this condition on the thermal resistance, particularly at elevated voltages. Overall, as shown in Fig. 5(i), a comparison of normally charged and overcharged batteries reveals marked deterioration in both activation energy and thermal runaway behavior, underscoring the pronounced reduction in thermal stability after overcharging, especially under higher voltage stress. TGA have been conducted to verify the connection between the degradation of the positive electrode after overcharging and the degradation of the battery's thermal stability. Based on the TGA mass loss curves (Fig. S17), we can conclude that the sample after overcharging occurs a composition reaction first, corresponding to the lower self-heating temperature of overcharged battery. However, the NCM cathode after overcharging decomposes more slowly at high temperatures compared to the NC cathode material, and is basically completely decomposed at 209.6 ℃. This is consistent with the long thermal runaway time of LTO after overcharging which can be attributed to the loss of active materials in the cathode material after overcharging. Figure S18 shows the comparison of different types of battery. Overall, LTO batteries outperform most transition metal oxide/graphite systems in terms of the thermal stability and the intensity of thermal runaway, except for the LCO/graphite system mentioned. However, after CVOC, the thermal stability of the battery significantly decreases, with the self-heating temperature advancing by approximately 44.7 ℃ and the thermal runaway temperature also increasing. Compared with other battery systems, NCM/LTO batteries have a greater risk of self-heating after overcharging. Additionally, although the highest temperature of thermal runaway increases after CVOC, it is still significantly lower than that of the mentioned NCM111, 622, 523, 811, and NCA systems, etc.
The experimental investigation into the degradation mechanism of the CVOC and LTO/NCM batteries revealed that 3.5 V is a critical threshold voltage beyond which detrimental overcharge effects are triggered. Surpassing this threshold induces irreversible electrochemical reactions, leading to a progressive decline in discharge capacity. Comprehensive analyses both noninvasively and postmortem demonstrate that fragmentation of the positive electrode material and the formation of interfacial byproducts are the principal drivers of capacity fading and compromised thermal safety. The degradation mechanism arises from the strong coupling of three failure modes: LLI, LAM, and ORI. Postmortem characterization further revealed that the growth of a thicker, organic-rich SEI layer, together with associated byproducts, is a key factor in the deterioration of thermal stability, reflected in a 44.8 °C reduction in the self-heating temperature. In addition, the destabilization of electrode interfacial structures and the deposition of byproducts following overcharging accelerate intense thermal runaway reactions and increase the thermal runaway temperature. Overall, these findings provide fundamental insights into the degradation pathways of LTO/NCM batteries under CVOC conditions, establishing a scientific basis for defining safety thresholds, improving thermal management system design, and optimizing battery management strategies.
Jintao Li: experimentalize, characterization, data collection, writing-original draft preparation; Zhenhao Luo: data collection; Pushpendra Kumar: writing; Songtong Zhang: investigation, validation, supervision; Jing Wang: investigation, validation, supervision; Xianfeng Hao: experimentalize, data collection; Xiayu Zhu: data curation, characterization; Wenjie Meng: experimentalize, data collection; Jingyi Qiu: investigation, validation, supervision; Hai Ming: conceptualization, methodology, writing-reviewing and editing.
Additional supporting information can be found online in the Supplemental Items.
S. V. Venkatesan, A. Nandy, K. Karan, S. R. Larter, and V. Thangadurai, "Recent advances in the unconventional design of electrochemical energy storage and conversion devices," Electrochemical Energy Reviews, vol. 5, no. 4, art. no. 16, 2022.
M. Li, J. Lu, Z. Chen, and K. Amine, "30 Years of Lithium-Ion batteries," Advanced Materials, vol. 30, no. 33, art. no. 1800561, 2018.
Z. Guo, Z. Ma, J. Liu, W. Zhao, S. Wang, H. Zhao, and L. Ren, "Overcharging cycle aging-induced severe degradation of safety properties of lithium-ion pouch battery cells subjected to mechanical abuse," Energy, vol. 320, art. no. 135168, 2025.
H. Zhang, Y. Yang, H. Xu, L. Wang, X. Lu, and X. He, "Li4Ti5O12 spinel anode: Fundamentals and advances in rechargeable batteries," InfoMat, vol. 4, no. 4, art. no. e12228, 2021.
S. Liu, M. Winter, M. Lewerenz, J. Becker, D. U. Sauer, Z. Ma, and J. Jiang, "Analysis of cyclic aging performance of commercial Li4Ti5O12-based batteries at room temperature," Energy, vol. 173, pp. 1041–1053, 2019.
T. Omiya, A. Ikezawa, K. Takahashi, K. Saito, M. Yonemura, T. Saito, T. Kamiyama, and H. Arai, "Combination of float charging and occasional discharging to cause serious LIB degradation analyzed by operando neutron diffraction," Energy Advances, vol. 3, no. 2, pp. 529–542, 2024.
H. Zhang, X. Lai, and L. Zhou, "A quantitative internal-short-circuit diagnosis method of lithium-ion batteries for float charging systems," Journal of Energy Storage, vol. 96, art. no. 112689, 2024.
H. Chen, A. Chahbaz, S. Yang, W. Zhang, D. U. Sauer, and W. Li, "Thermodynamic and kinetic degradation of LTO batteries: impact of different SOC intervals and discharge voltages in electric train applications," eTransportation, vol. 21, art. no. 100340, 2024.
H. Chen, S. Yang, W. Zhang, C. Zhang, B. Sun, and D. Chen, "An aging-aware modified open-circuit potential electrode model for degradation modes diagnosis of lithium titanate oxide batteries," J. Power Sources, vol. 614, art. no. 234921, 2024.
G. Baure, and M. Dubarry, "Battery durability and reliability under electric utility grid operations: 20-year forecast under different grid applications," J. Energy Storage, vol. 29, art. no. 101391, 2020.
M. Soltani, S. B. Vilsen, A. I. Stroe, V. Knap, and D. I. Stroe, "Degradation behaviour analysis and end-of-life prediction of lithium titanate oxide batteries," Journal of Energy Storage, vol. 68, art. no. 107745, 2023.
X. Lai, B. Li, X. Tang, Y. Zhou, Y. Zheng, and F. Gao, "A quantitative method for early-stage detection of the internal-short-circuit in Lithium-ion battery pack under float-charging conditions," Journal of Power Sources, vol. 573, art. no. 233109, 2023.
Q. Tian, "Research on application of lithium titanate battery in auxiliary system of rail vehicle," IOP Conference Series: Materials Science and Engineering, vol. 366, art. no. 012087, 2018.
T. Yin, L. Zheng, L. Jia, Y. Feng, D. Wang, and Z. Dai, "Overview of research on float charging for lithium-ion batteries," Energy Storage Science and Technology, vol. 10, no. 1, art. no. 310, 2021.
T. Tsujikawa, K. Yabuta, T. Matsushita, M. Arakawa, and K. Hayashi, "A study on the cause of deterioration in float-charged lithium-ion battery," ECS Transactions, vol. 25, no. 36, art. no. 309, 2010.
L. Spitthoff, P. J. S. Vie, M. S. Wahl, J. Wind, and O. S. Burheim, "Incremental capacity analysis (dQ/dV) as a tool for analysing the effect of ambient temperature and mechanical clamping on degradation," J. Electroanal. Chem., vol. 944, art. no. 117627, 2023.
P. Arora, R. E. White, and M. Doyle, "Capacity fade mechanisms and side reactions in lithium‐ion batteries," Journal of The Electrochemical Society, vol. 145, no. 10, pp. 3647–3667, 1998.
J. Gao, B. Gong, Q. Zhang, G. Wang, Y. Dai, and W. Fan, "Study of the surface reaction mechanism of Li4Ti5O12 anode for lithium-ion cells," Ionics, vol. 21, no. 9, pp. 2409–2416, 2015.
T. Yin, L. Jia, X. Li, L. Zheng, and Z. Dai, "Effect of high-rate cycle aging and over-discharge on NCM811 (LiNi0.8Co0.1Mn0.1O2) batteries," Energies, vol. 15, no. 8, art. no. 2862, 2022.
J. Liu, M. Yue, S. Wang, Y. Zhao, and J. Zhang, "A review of performance attenuation and mitigation strategies of lithium‐ion batteries," Advanced Functional Materials, vol. 32, no. 8, art. no. 2107769, 2021.
M. Dubarry, and D. Anseán, "Best practices for incremental capacity analysis," Front. Energy Res., vol. 10, art. no. 1023555, 2022.
M. Dubarry, V. Svoboda, R. Hwu, and B. Yann Liaw, "Incremental capacity analysis and close-to-equilibrium OCV measurements to quantify capacity fade in commercial rechargeable lithium batteries," Electrochemical and Solid-State Letters, vol. 9, no. 10, art. no. A454, 2006.
Y. Hao, K. Li, S. Zhang, J. Wang, X. Zhu, W. Meng, J. Qiu, and H. Ming, "Failure of lithium-ion batteries accelerated by gravity," ACS Applied Materials & Interfaces, vol. 16, no. 21, pp. 27400–27409, 2024.
I. Bloom, A. N. Jansen, D. P. Abraham, J. Knuth, S. A. Jones, V. S. Battaglia, and G. L. Henriksen, "Differential voltage analyses of high-power, lithium-ion cells," Journal of Power Sources, vol. 139, no. 1–2, pp. 295–303, 2005.
J. Wang, J. Purewal, P. Liu, J. Hicks-Garner, S. Soukazian, E. Sherman, A. Sorenson, L. Vu, H. Tataria, and M. W. Verbrugge, "Degradation of lithium ion batteries employing graphite negatives and nickel–cobalt–manganese oxide + spinel manganese oxide positives: Part 1, aging mechanisms and life estimation," Journal of Power Sources, vol. 269, pp. 937–948, 2014.
E. Moazzen, R. Scipioni, M. Ma, and S. Barnett, "Interpretation and modelling of the electrochemical impedance of LiFePO4/Li4Ti5O12 batteries," Journal of The Electrochemical Society, vol. 168, no. 5, art. no. 050519, 2021.
Y. Lu, C.-Z. Zhao, J.-Q. Huang, and Q. Zhang, "The timescale identification decoupling complicated kinetic processes in lithium batteries," Joule, vol. 6, no. 6, pp. 1172–1198, 2022.
F. Zhao, J. Wang, T. Jiang, Y. Si, X. Zhu, S. Zhang, K. Li, W. Meng, H. Zhang et al., "Internal resistance reduction strategies for high-power and fast-charging Lithium-ion batteries," Materials Science and Engineering: R: Reports, vol. 166, p. 101076, 2025.
T. H. Wan, M. Saccoccio, C. Chen, and F. Ciucci, "Influence of the discretization methods on the distribution of relaxation times deconvolution: implementing radial basis functions with DRTtools," Electrochimica Acta, vol. 184, pp. 483–499, 2015.
H. Schichlein, A. C. Müller, M. Voigts, A. Krügel, and E. Ivers-Tiffée, "Deconvolution of electrochemical impedance spectra for the identification of electrode reaction mechanisms in solid oxide fuel cells," Journal of Applied Electrochemistry, vol. 32, no. 8, pp. 875–882, 2002.
M.-C. Liu, H.-J. Chen, G. Wu, X.-L. Wang, and Y.-Z. Wang, "Multifunctional robust aerogel separator towards high-temperature, large-rate, long-cycle lithium-ion batteries," Chinese Chemical Letters, vol. 34, no. 5, art. no. 107546, 2023.
P. Schröer, H. van Faassen, T. Nemeth, M. Kuipers, and D. U. Sauer, "Challenges in modeling high power lithium titanate oxide cells in battery management systems," Journal of Energy Storage, vol. 28, art. no. 101189, 2020.
Z. Liang, Y. Peng, X. Zhang, K. Cao, W. Xiao, and D. Gu, "Sulfur-doped CMK-5 with expanded lattice for high-performance lithium ion batteries," Chinese Chemical Letters, vol. 34, no. 7, art. no. 108054, 2023.
S. Zhang, Z. Yang, Y. Lu, W. Xie, Z. Yan, and J. Chen, "Insights into cation migration and intermixing in advanced cathode materials for lithium-ion batteries insights into cation migration and intermixing in advanced cathode materials for lithium‐ion batteries," Advanced Energy Materials, vol. 14, no. 36, art. no. 2402068, 2024.
Y. Guo, X. Qu, Z. Li, R. Tian, and X. Liu, "A scalable one-pot strategy for the development of polymer electrolytes adaptable to room-temperature high-voltage lithium batteries," Chinese Chemical Letters, vol. 35, no. 3, art. no. 108482, 2024.
J. Hwang, K. Do, and H. Ahn, "Highly conductive 3D structural carbon network-encapsulated Ni-rich LiNi0.8Co0.1Mn0.1O2 as depolarized and passivated cathode for lithium-ion batteries," Chem. Eng. J., vol. 406, art. no. 126813, 2021.
T. Nordh, R. Younesi, M. Hahlin, R. F. Duarte, C. Tengstedt, D. Brandell, and K. Edström, "Manganese in the SEI layer of Li4Ti5O12 studied by combined NEXAFS and HAXPES techniques," The Journal of Physical Chemistry C, vol. 120, no. 6, pp. 3206–3213, 2016.
W. Liang, X. Zhou, B. Zhang, Z. Zhao, X. Song, K. Chen, L. Wang, Z. Ma, and J. Liu, "The versatile establishment of charge storage in polymer solid electrolyte with enhanced charge transfer for LiF-Rich SEI generation in lithium metal batteries," Angewandte Chemie International Edition, vol. 63, no. 18, art. no. 202320149, 2024.
F. Lv, Y. Zhang, M. Wu, and Y. Gu, "A molten-salt method to synthesize ultrahigh-nickel single-crystalline LiNi0.92 Co0.06 Mn0.02 O2 with superior electrochemical performance as cathode material for lithium-ion batteries," Small, vol. 18, no. 28, art. no. e2201946, 2022.
X. Feng, D. Ren, X. He, and M. Ouyang, "Mitigating thermal runaway of lithium-ion batteries," Joule, vol. 4, no. 4, pp. 743–770, 2020.
T. Gao, J. Bai, D. Ouyang, Z. Wang, W. Bai, N. Mao, and Y. Zhu, "Effect of aging temperature on thermal stability of lithium-ion batteries: part A – high-temperature aging," Renewable Energy, vol. 203, pp. 592–600, 2023.
H. Du, Y. Wang, Y. Kang, Y. Zhao, Y. Tian, X. Wang, Y. Tan, Z. Liang, J. Wozny et al., "Side reactions/changes in lithium‐ion batteries: mechanisms and strategies for creating safer and better batteries," Advanced Materials, vol. 36, no. 29, art. no. 2401482, 2024.
 Top
Top