ContentsFigures & Tables
Lithium-ion batteries are widely used in electric vehicles because of their high energy density, long cycle life, and high power capacity [1–5]. Batteries encounter complex electrochemical-thermal-mechanical coupled interactions during practical operation. Developing multi-physics coupling models for lithium-ion batteries plays a crucial role in enhancing the accuracy of performance prediction and safety evaluation [6–8]. Under normal charging conditions, battery volume expansion occurs due to lithium-ion intercalation processes and heat generation. Under conditions such as overcharging [9], low-temperature charging [10], and fast charging [11], lithium metal deposition occurs on the negative electrode surface, leading to more severe battery volume expansion [12]. Lithium plating not only leads to capacity degradation [13] but may also evolve into lithium dendrites, causing internal short circuits and resulting in thermal runaway of the battery [14]. Meanwhile, the volume expansion of lithium-ion batteries can generate significant stress in battery modules or packs, which may lead to mechanical deformation and failure of the battery, as well as cause failure/fracture of active materials inside the battery, thereby affecting battery safety performance [15–17]. Therefore, establishing an electrochemical-thermo-mechanical coupling model of lithium batteries that considers lithium plating is essential for enhancing the safety performance of lithium batteries.
The expansion of lithium batteries during charging is caused by lithium-ion intercalation [18], thermal expansion [19], and side reactions inside the battery, such as lithium plating [20], solid electrolyte interface (SEI) film growth [21], and gas generation [22]. During charging, lithium-ion deintercalates from the cathode and intercalates into the anode. Since the crystal volume expansion of anode particles is greater than the crystal volume contraction of cathode particles, this results in an overall volume expansion of the battery [23]. During the charging process, heat generation causes the battery temperature to rise, resulting in thermal expansion of the battery components. The extent of this thermal expansion is directly related to the material's coefficient of thermal expansion [24]. Intercalation expansion and thermal expansion during low-rate battery charging are normal expansion phenomena. However, when lithium plating occurs during fast charging, the deposited lithium on the anode surface leads to an increase in anode thickness, resulting in abnormal battery expansion. This abnormal volume expansion can be significantly higher than normal expansion [25]. Due to the constraint effects on battery surfaces within modules, free expansion transforms into a constrained expansion force. The expansion force caused by lithium plating is significantly higher than that caused by intercalation expansion and thermal expansion. Studies have shown that multi-stage constant current (MCC) charging can reduce lithium plating while maintaining charging efficiency [26, 27]. Developing appropriate MCC charging strategies based on battery expansion force models can reduce lithium plating, thereby decreasing battery expansion force.
The operational mechanism of lithium-ion batteries encompasses a multi-physics coupling process. Extensive research has been conducted on the electrochemical-thermal-mechanical coupling models that characterize battery behavior during charge-discharge cycles. Sun et al. developed a heterogeneous electrochemical-thermal-mechanical (HETM) multi-physics coupling model for lithium-ion batteries, providing more accurate data for battery design and optimization [6]. Ai et al. investigated the stress response in electrode particles through a pseudo-two-dimensional model of mechanical-coupled diffusion physics, demonstrating the evolution of internal stress within electrode particles and the heterogeneity of stress distribution inside battery electrodes [7]. Wang et al. proposed a multi-scale modeling approach for electrochemical-mechanical coupling in lithium-ion batteries, analyzing the distribution and evolution of internal stresses [28]. While these models provide particle-level insights into stress evolution during lithium-ion battery cycling, they lack descriptions of expansion forces under macroscopic constraints, as well as analysis of abnormal battery expansion forces caused by lithium plating during fast charging. Meanwhile, MCC charging strategies to reduce lithium plating are a critical research direction in fast-charging technology for lithium-ion batteries. Tahir et al. investigated the impacts of MCC charging protocol on charging duration, charge-discharge capacity, charging efficiency, and maximum and average temperature rise of the battery [29]. Wu et al. developed an experimental protocol to address the multi-objective optimization of multi-stage current coordination, validating that MCC charging effectively regulates battery temperature rise and mitigates capacity fade during long-term cycling [30]. Shen et al. proposed a method based on dynamic impedance measurement to detect lithium plating during battery charging in the MCC charging [31]. However, investigations into the expansion force of lithium-ion batteries under MCC conditions, particularly considering lithium plating effects, remain relatively scarce. Therefore, it is necessary to establish an electrochemical-thermal-mechanical coupling model under MCC charging to investigate the expansion force changes of lithium-ion batteries and propose an MCC charging strategy based on expansion force variations.
To establish an electrochemical-thermal-mechanical coupling model under MCC charging and develop a charging strategy based on expansion force feedback, this paper first experimentally calibrates the thermal expansion coefficient and equivalent stiffness of lithium batteries and measures the voltage, temperature, and expansion force during charging at different C-rates. Based on the experimental data, an electrochemical-thermal-mechanical coupling model considering lithium plating is established and validated to simulate the evolution of voltage, temperature, and expansion force during the charging process. Experiments and simulations demonstrate that lithium plating at high C-rates leads to increased expansion force. Thus, the battery expansion force can serve as an indicator for lithium plating. Building upon the electrochemical-thermal-mechanical coupling model, by modifying single-stage constant current charging to two-stage constant current charging, it is proven that reducing the charging current can lower battery temperature rise and expansion force. By implementing MCC charging, a semi-quantitative simulation of battery expansion force under MCC is achieved. By calculating expansion force changes at every 10% SOC increment, a model-based MCC charging strategy is developed. Compared to constant current charging, this strategy maintains charging speed while effectively controlling battery temperature rise and reducing expansion force, thereby suppressing lithium plating. Through experiments and simulations, this paper establishes an electrochemical-thermal-mechanical coupling model, calculates the lithium plating onset state of charge (SOC) and expansion force under different charging rates, and proposes optimization directions for the MCC charging strategy based on the electrochemical-thermal-mechanical coupling model.
In this study, experiments were conducted on a 34 A·h commercial pouch NCM/graphite battery using a battery testing system. All charge and discharge experiments were performed in a temperature-controlled chamber to ensure constant ambient temperature conditions. Temperature variations were monitored using thermocouples attached to the battery surface.
The experiment consists of three parts: the first part is to measure the equivalent stiffness of the battery; the second part is to measure the thermal expansion coefficient of the battery; and the third part is to conduct charge-discharge tests and measure the voltage, temperature, and expansion force of the battery under different C-rates. During the expansion force measurement, the battery was constrained by the three-layer plate fixture, with a weighing sensor placed at the bottom layer to measure the expansion force under constraint. When measuring the free expansion displacement, the battery was removed from the three-layer plate, allowing it to expand without external constraints. This study used a weighing sensor with a range of 300 kg and an accuracy of ±0.1% full scale. For measuring the battery's free expansion, a digital height gauge with an accuracy of 1 micron was employed. The arrangement of the battery in the three-layer plate fixture for battery expansion force measurement is illustrated in Fig. 1. The battery generates expansion force due to the restriction of expansion displacement when charging under fixture constraints, as shown in Fig. 1.
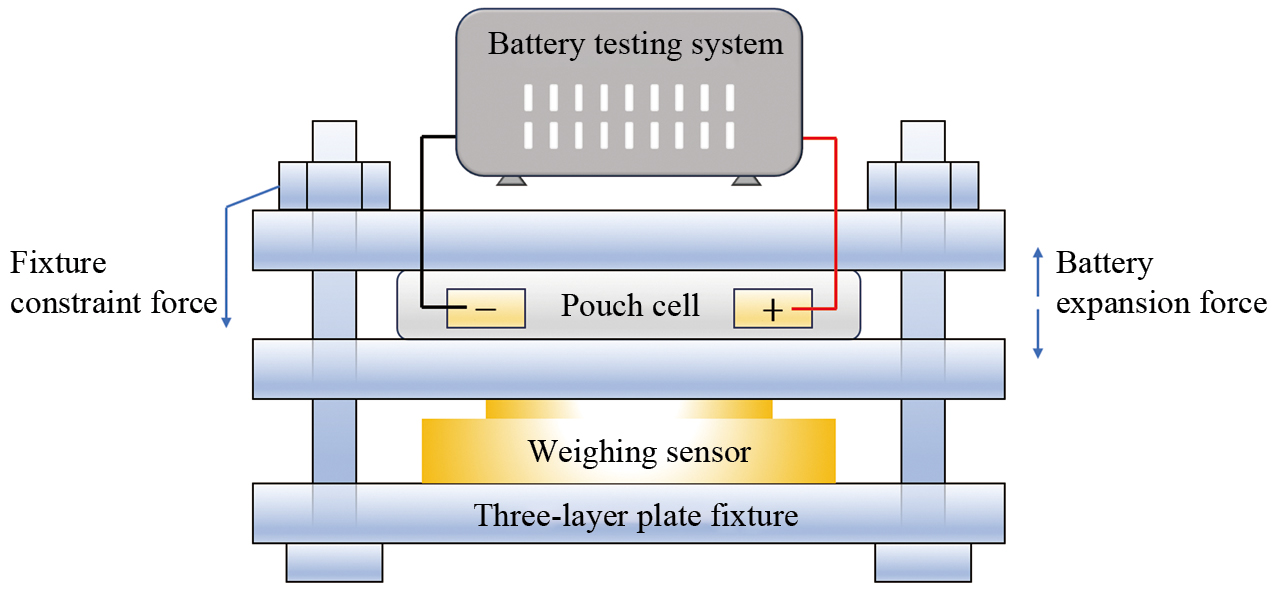
First, at 298.15 K, three charge–discharge pre-cycles were performed on the fresh battery to activate its electrochemical performance. The battery was charged through constant current (CC) and constant voltage (CV) steps at 0.5 C current to a cut-off voltage of 4.25 V with a cut-off current of 0.1 A, then discharged to 2.95 V. Afterward, at 298.15 K, CCCV charging at a 0.2 C rate was performed on the discharged battery. A digital height gauge was used to measure the battery's free expansion displacement. The battery was then constrained by a three-layer plate and charged at the same 0.2 C rate, with a weighing sensor measuring the expansion force during the charging process. Since lithium plating does not occur during low-rate charging at 298.15 K, and the battery's heat generation is minimal while in the temperature chamber, the temperature rise can be considered negligible. Therefore, the expansion displacement and the expansion force under the three-layer plate constraint can be attributed solely to lithium-ion intercalation within the battery. The average equivalent stiffness during the intercalation process can be calculated from the measured free expansion displacement and expansion force at the corresponding rate. Since thermal expansion and lithium plating expansion occur at the same electrode scale as intercalation expansion, the obtained average equivalent stiffness can be considered applicable to both thermal and lithium plating expansion. At 298.15 K, pulse heating was applied to the battery, and the expansion displacement was measured using a height gauge, with the battery outside the temperature chamber. The battery's SOC can be considered unchanged under pulse current, so there is no intercalation expansion, only thermal expansion. The battery's average thermal expansion coefficient was obtained through measurements of temperature rise and thermal expansion displacement.
At 293.15 K, the battery was constrained by the three-layer plate with bolts tightened to apply an initial preload of 100 kg and placed in a temperature chamber for charging tests. CC charging was performed at different charging rates (0.4 C, 0.6 C, 0.8 C, 1.0 C, 1.5 C, and 2.0 C) up to 4.25 V to obtain the voltage, temperature, and expansion force curves at corresponding rates.
The modeling was implemented in COMSOL Multiphysics® 6.2 using the Pseudo-two-dimensional model based on porous electrode theory developed by Newman et al. [32, 33], which can calculate battery voltage and electrode potentials for both positive and negative electrodes. The model assumes that the active particles are uniform spheres; the schematic of the P2D model is shown in Fig. 2(a). During fast battery charging, lithium metal can be deposited on the surface of the negative electrode, as shown in Fig. 2(b). The internal physical and chemical processes during the charge and discharge processes of the battery can be described by the following equations.
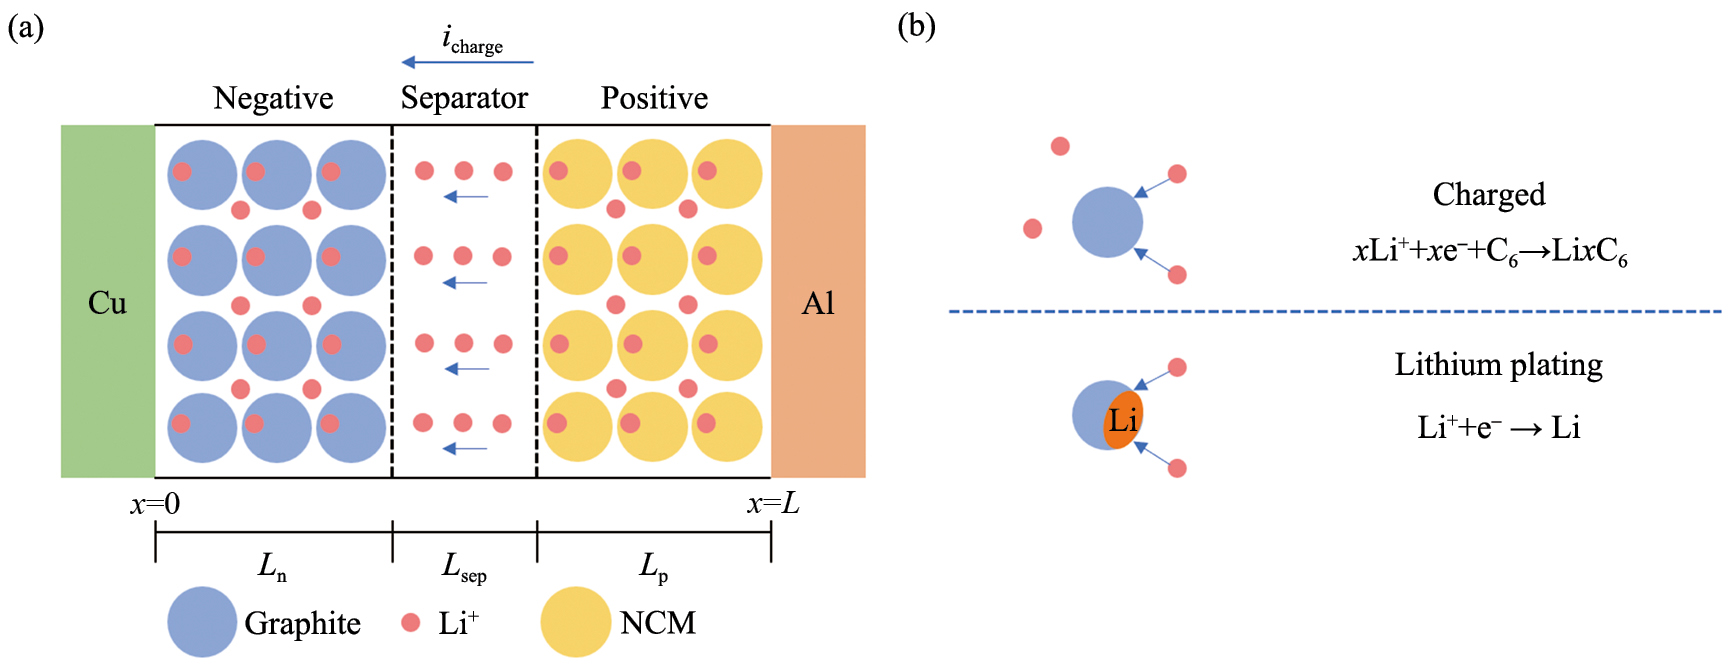
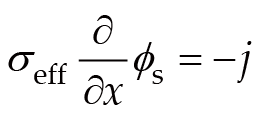
Ohm's law applies to both the solid and liquid phases, and the solid phase potential is expressed by the following equation:(1)where ϕs is the solid phase potential, j is the current density, and σeff represents the effective conductivity.
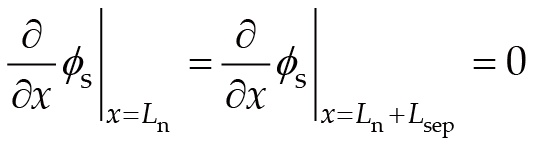
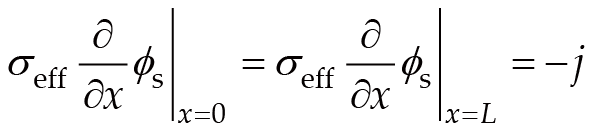
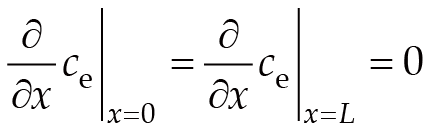
The boundary conditions are:(2)(3)where Ln denotes the negative electrode thickness, Lsep is the separator thickness, and L represents the overall thickness of a complete electrode, respectively.
Electrolyte potential distribution in the liquid phase is ϕe:(4)where keff represents the effective ionic conductivity of the electrolyte, ce denotes the lithium-ion concentration in the electrolyte, represents the transfer number of lithium-ion, and F denotes the Faraday constant, respectively.
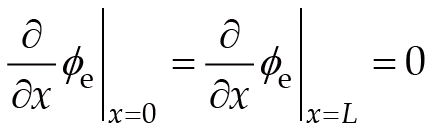
The boundary conditions are(5)
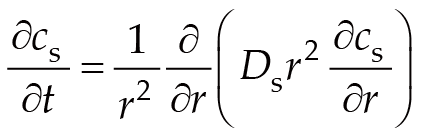
The distribution of lithium-ion concentration within the particle is described by Fick's second law:(6)where cs is the concentration of lithium in the solid phase, Ds is the solid-state diffusion coefficient of lithium-ion, and r denotes the particle radius, respectively.
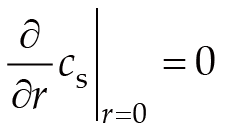
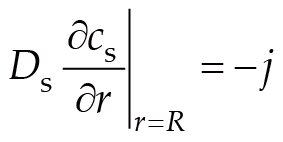
The boundary conditions are:(7)(8)
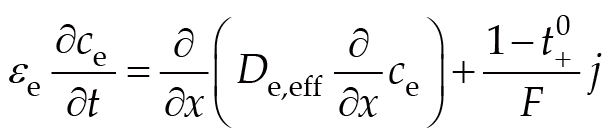
The distribution of lithium concentration in the electrolyte phase is described by the following equation:(9)
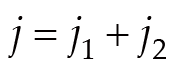
The boundary conditions are(10)
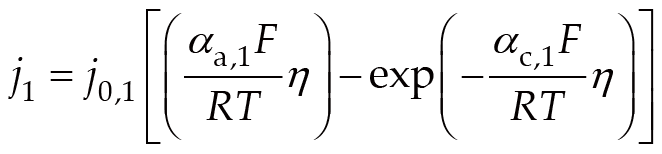
The intercalation and deintercalation reactions of lithium-ion at the solid electrolyte interphase follow the Butler-Volmer equation, where the local current density can be expressed as:(11)where j0,1 and η represent the exchange current density and overpotential, αa,1 and αc,1 are the anode and cathode transfer coefficients (both set to 0.5), R and F denote the gas constant and Faraday constant, which are generally taken as 8.314 J·mol–1∙K–1) and 96 485 C/mol, respectively. The local current density can be expressed as:(12)(13)
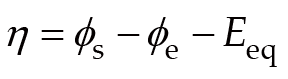
In the equation, k is the reaction rate constant, cs,max and cs,surf represent the maximum lithium concentration and surface lithium concentration in electrode particles, respectively, Eeq is the equilibrium potential of the electrode material, respectively.
The local current density of the lithium intercalation reaction can be calculated using the Butler-Volmer equation.(14)where j0,2 represents the exchange current density of the lithium plating reaction, αa,2 and αc,2 are the transfer coefficients of the lithium plating reaction. ηLi is the overpotential of lithium plating reaction, which is calculated by:(15)where Rfilm represents the generalized film resistance, the film is lithium metal deposited on the surface of the electrode active material, and ULi represents an additional variable caused by the potential change across the film.
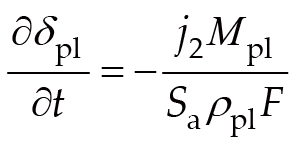
Based on mass conservation, the thickness of plated lithium metal (δpl) can be calculated by:(16)where Mpl and ρpl are the molar mass and density of lithium metal, respectively.
The battery charging current density is the sum of lithium intercalation and plating current densities, as calculated by(17)
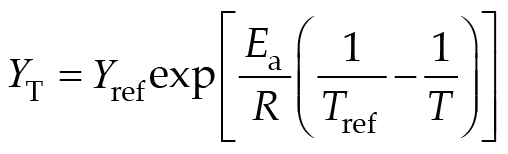
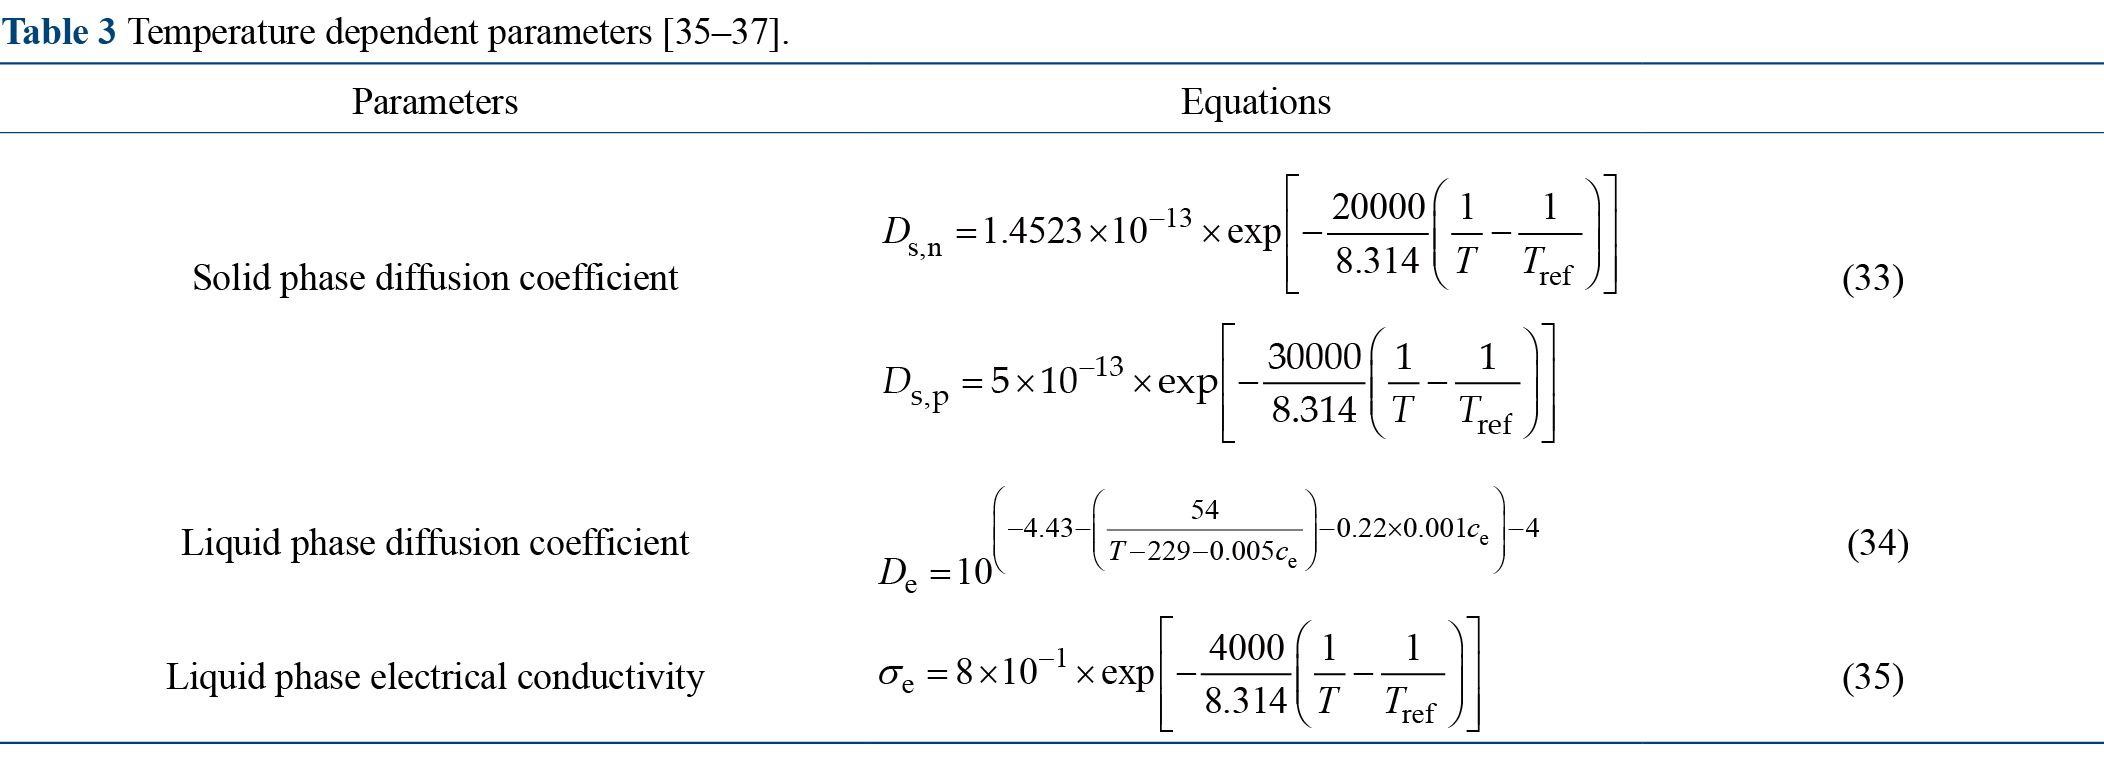
Some parameters in the model, such as diffusion coefficients, conductivity, and reaction rates, are temperature-dependent. The Arrhenius equation describes these relationships.(18)Where Tref is the reference temperature, Yref is the reference value at Tref, YT is the temperature-dependent parameter, and Ea is the activation energy corresponding to YT.
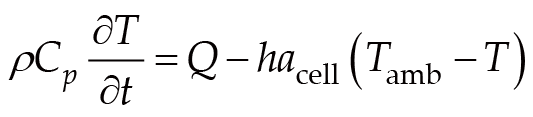
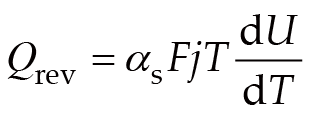
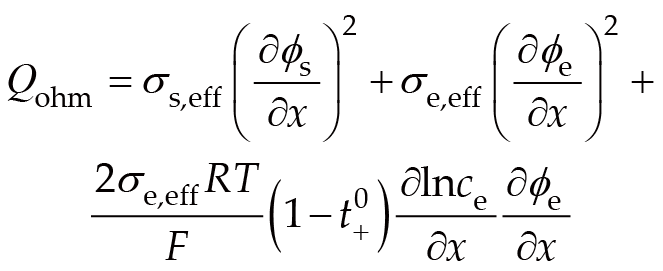
Assuming the temperature is uniformly distributed across the battery volume, the heat equation governs the thermal model.(19)where ρ is the material density, Cp is the specific heat capacity at constant pressure, h is the heat transfer coefficient between the battery and the environment, acell represents the specific surface area of the battery, and Tamb denotes the ambient temperature.(20)(21)(22)(23)(24)
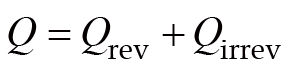
Q represents the average heat generation rate inside the battery, which is the sum of reversible heat (Qrev) and irreversible heat (Qirrev). The irreversible heat consists of ohmic heat (Qohm) and polarization heat (Qact). Ohmic heat is generated by current flowing through the internal resistance of battery materials, including Joule losses in both electrodes (solid phase) and electrolyte (liquid phase). Polarization heat is caused by the heat generated from electrochemical reaction kinetics polarization such as activation polarization and concentration polarization. The reversible heat (Qrev) originates from entropy changes during the battery reaction process.
During charging without fixture constraints, batteries generate free expansion displacement due to internal expansion effects, including intercalation expansion, thermal expansion, and side reactions such as lithium plating, SEI film growth, and gas generation. Since this model only considers a single cycle, and no significant gas generation was observed during the experiment, neither the battery expansion induced by SEI film growth nor the gas generation effects are considered. When charging under fixture constraints, the battery generates expansion force as its expansion displacement is restricted. The battery expansion force consists of the intercalation expansion force, the thermal expansion force, and the expansion force caused by lithium plating side reactions.
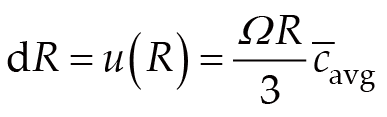
The thickness variation caused by lithium intercalation originates from alterations in the crystal structure and lattice parameters of the active materials. The radial displacement of anode active material particles after lithium-ion intercalation or deintercalation can be expressed as [34] :(25)where represents the lithium-ion concentration change relative to the current SOC's initial concentration, Ω is the partial molar volume of the material, r denotes the distance from the particle center along the particle radius, and R is the particle radius, respectively.
The variation in particle radius induced by lithium-ion intercalation/deintercalation is given by:(26)
Given that the thickness of the anode and cathode layers is much smaller than the length and width of the battery, the thickness variation can be estimated through volume changes [7] as:(27)ε represents the volume fraction of active material. Therefore, the thickness change of the battery induced by lithiation can be expressed by:(28)where L represents the thickness of a single electrode layer, and n denotes the number of electrode layers in the battery.
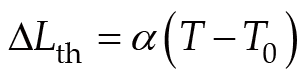
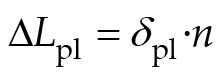
The expansion thickness induced by thermal expansion and lithium plating is determined by:(29)(30)
The thermal expansion coefficient α was calculated to be 1.5 μm·K–1 from the experimental data, and δpl is calculated by Eq. (16).
The total thickness expansion of the battery is(31)
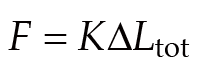
The following equation can calculate the battery expansion force:(32)K represents the battery's equivalent stiffness and is calibrated using a 0.2 C charging rate, with an average value of 5.2 N·μm–1 determined through experimental measurements.
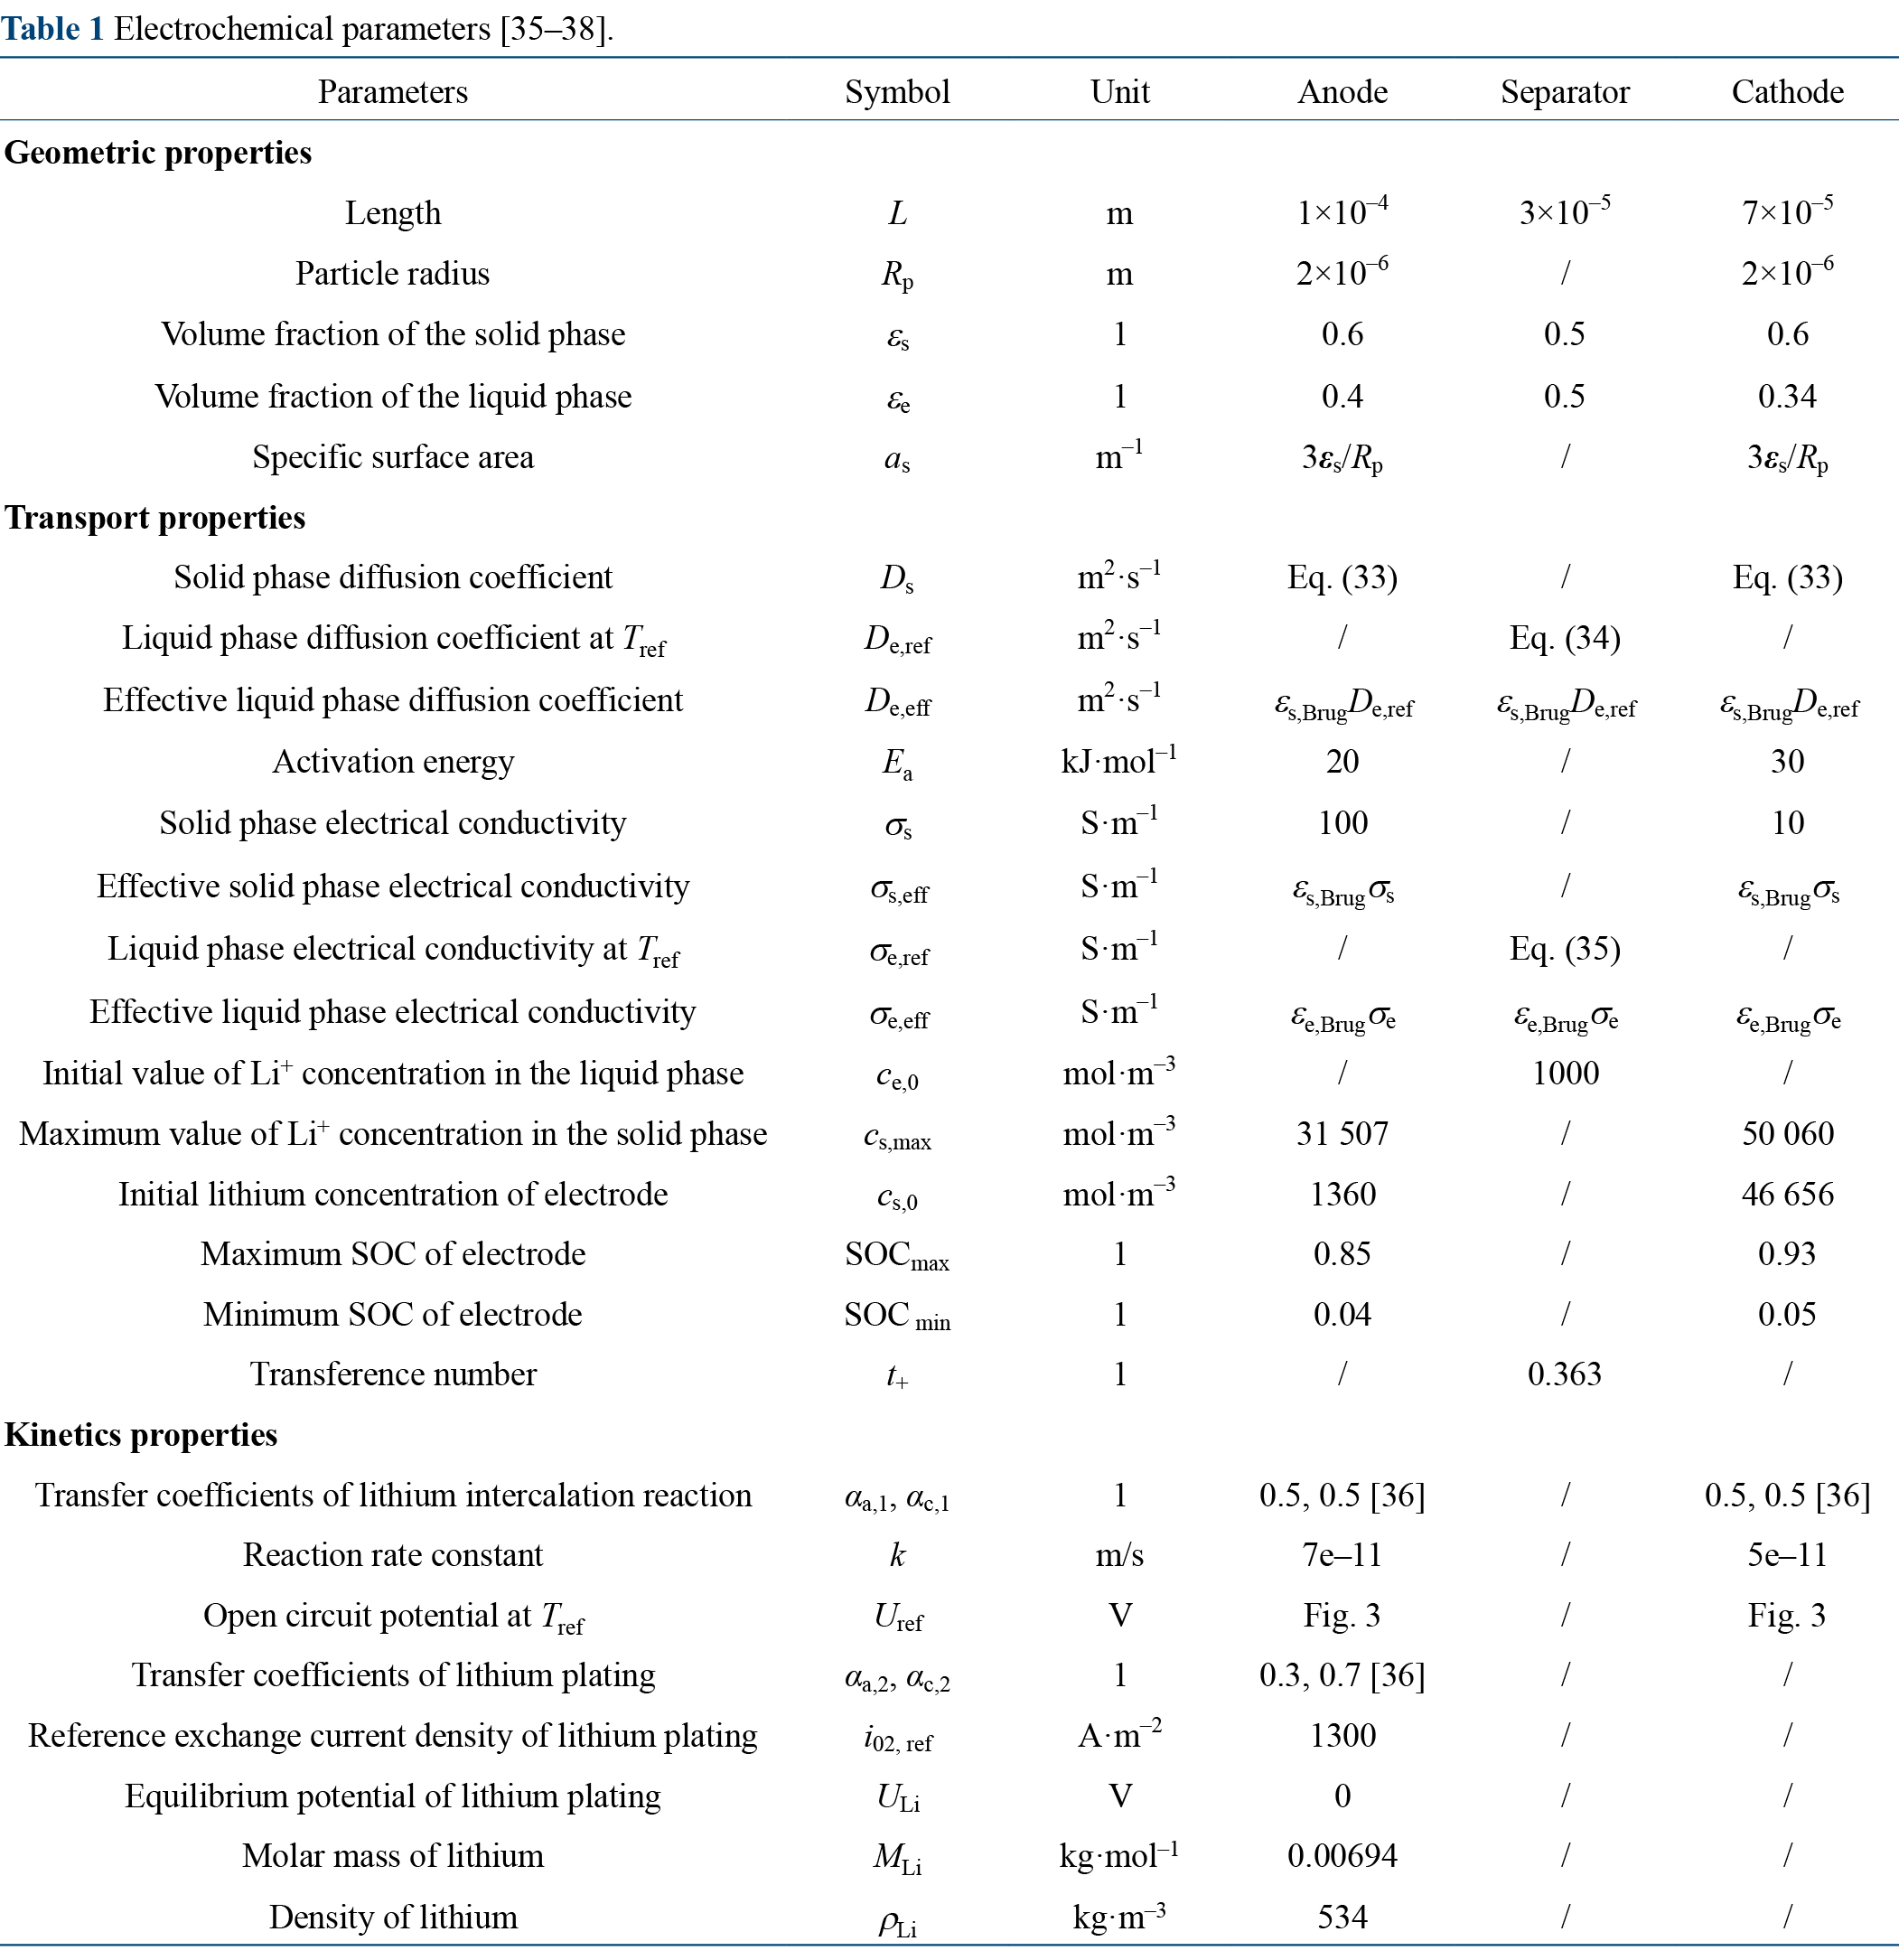
The battery's electrochemical and thermal parameters are derived from manufacturers, existing literature, and parameter identification, as shown in Tables 1–3.
| Parameters | Symbol | Unit | Anode | Separator | Cathode |
|---|---|---|---|---|---|
| Geometric properties | |||||
| Length | L | m | 1×10⁻⁴ | 3×10⁻⁵ | 7×10⁻⁵ |
| Particle radius | Rp | m | 2×10⁻⁶ | / | 2×10⁻⁶ |
| Volume fraction of the solid phase | εs | 1 | 0.6 | 0.5 | 0.6 |
| Volume fraction of the liquid phase | εe | 1 | 0.4 | 0.5 | 0.34 |
| Specific surface area | as | m–1 | 3εs/Rp | / | 3εs/Rp |
| Transport properties | |||||
| Solid phase diffusion coefficient | Ds | m2·s–1 | Eq. (33) | / | Eq. (33) |
| Liquid phase diffusion coefficient at Tref | De,ref | m2·s–1 | / | Eq. (34) | / |
| Effective liquid phase diffusion coefficient | De,eff | m2·s–1 | εs,BrugDe,ref | εs,BrugDe,ref | εs,BrugDe,ref |
| Activation energy | Ea | kJ·mol–1 | 20 | / | 30 |
| Solid phase electrical conductivity | σs | S·m–1 | 100 | / | 10 |
| Effective solid phase electrical conductivity | σs,eff | S·m–1 | εs,Brugσs | / | εs,Brugσs |
| Liquid phase electrical conductivity at Tref | σe,ref | S·m–1 | / | Eq. (35) | / |
| Effective liquid phase electrical conductivity | σe,eff | S·m–1 | εe,Brugσe | εe,Brugσe | εe,Brugσe |
| Initial value of Li+ concentration in the liquid phase | ce,0 | mol·m–3 | / | 1000 | / |
| Maximum value of Li+ concentration in the solid phase | cs,max | mol·m–3 | 31 507 | / | 50 060 |
| Initial lithium concentration of electrode | cs,0 | mol·m–3 | 1360 | / | 46 656 |
| Maximum SOC of electrode | SOCmax | 1 | 0.85 | / | 0.93 |
| Minimum SOC of electrode | SOC min | 1 | 0.04 | / | 0.05 |
| Transference number | t+ | 1 | / | 0.363 | / |
| Kinetics properties | |||||
| Transfer coefficients of lithium intercalation reaction | αa,1, αc,1 | 1 | 0.5, 0.5 [36] | / | 0.5, 0.5 [36] |
| Reaction rate constant | k | m/s | 7e–11 | / | 5e–11 |
| Open circuit potential at Tref | Uref | V | Fig. 3 | / | Fig. 3 |
| Transfer coefficients of lithium plating | αa,2, αc,2 | 1 | 0.3, 0.7 [36] | / | / |
| Reference exchange current density of lithium plating | i02, ref | A·m–2 | 1300 | / | / |
| Equilibrium potential of lithium plating | ULi | V | 0 | / | / |
| Molar mass of lithium | MLi | kg·mol–1 | 0.00694 | / | / |
| Density of lithium | ρLi | kg·m–3 | 534 | / | / |
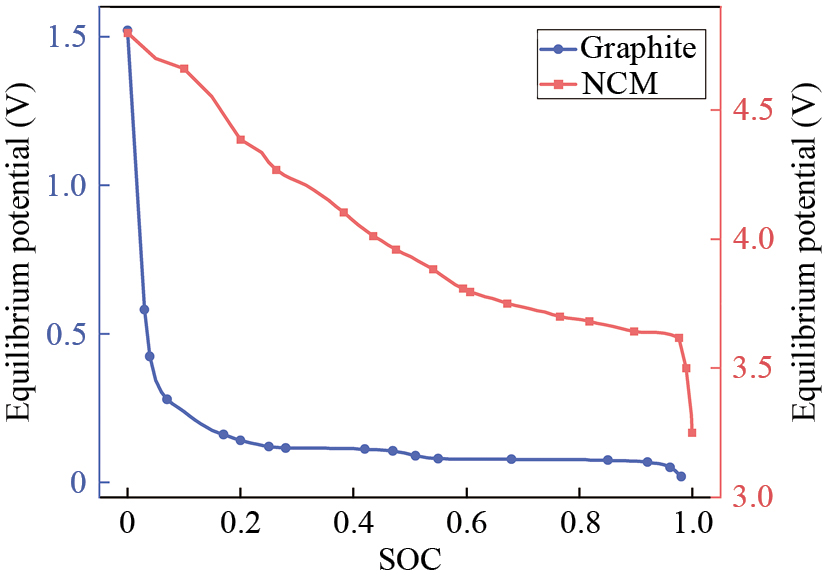
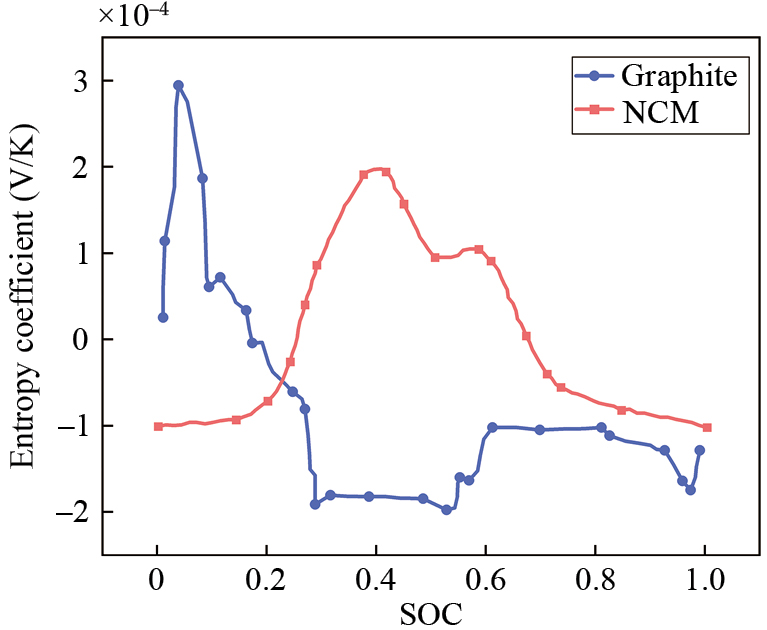
The convective heat transfer coefficient between the battery and the ambient temperature is considered as 10 W·m–2·K–1. The measured equilibrium potential of NCM and graphite with SOC are shown in Fig. 3. The entropy coefficient of NCM and graphite with SOC according to Ref. [41] are shown in Fig. 4.
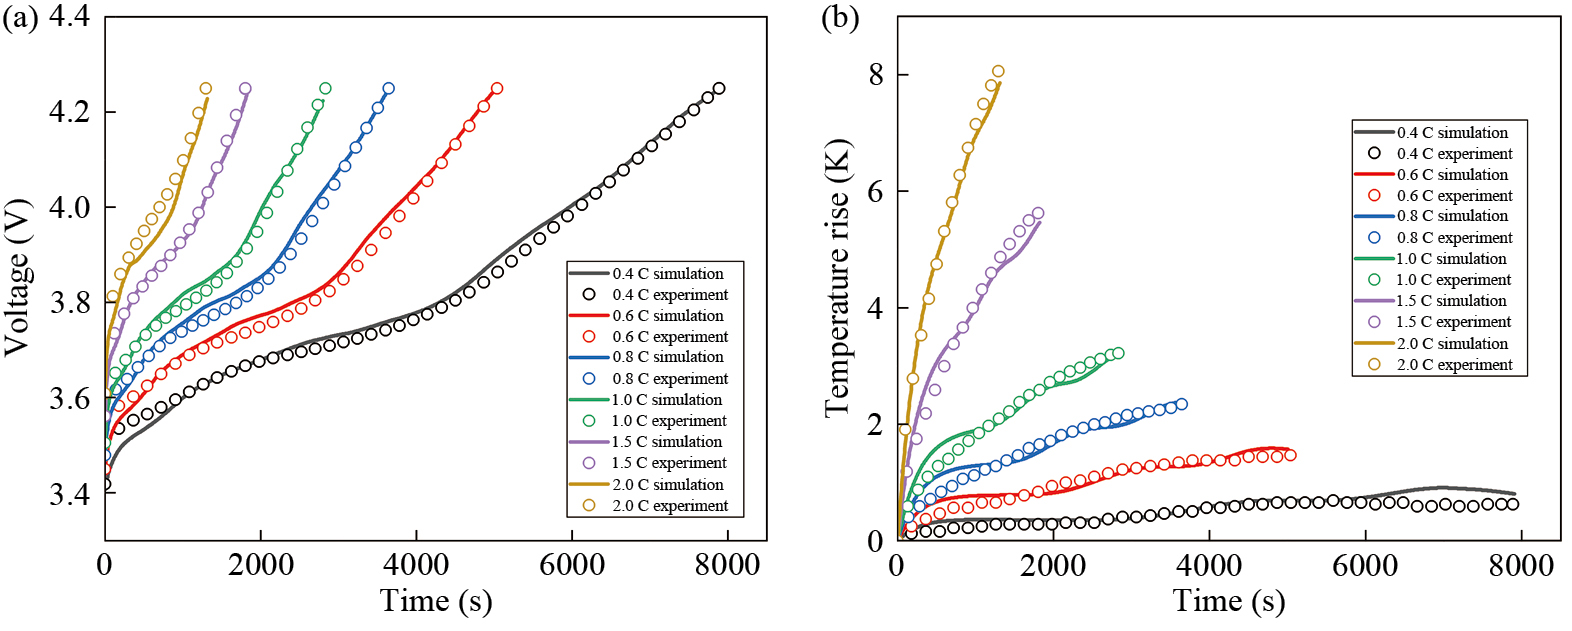
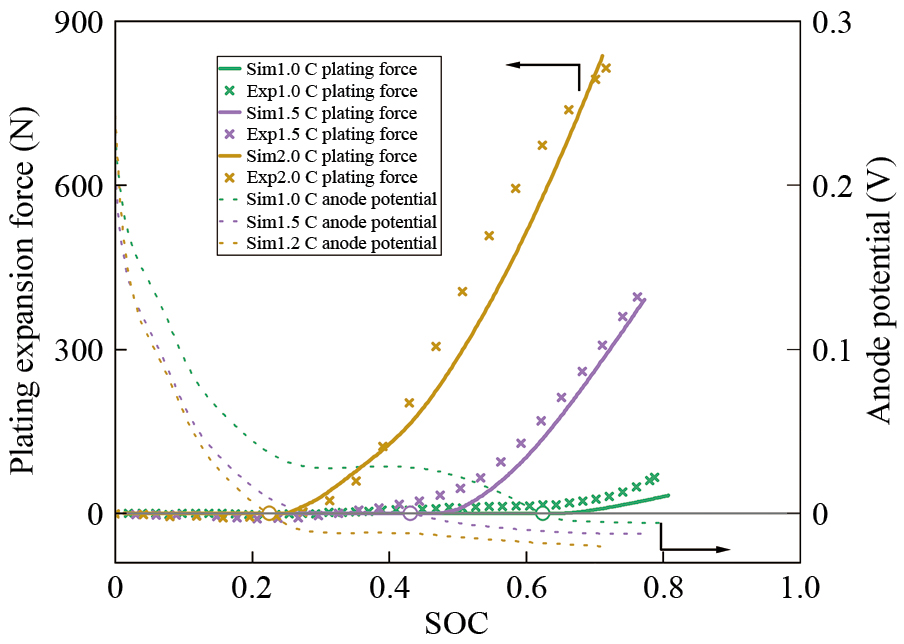
Figure 5 demonstrates the model validation in terms of electrochemistry and temperature rise. As shown in Fig. 5, the simulated battery voltage and temperature rise during charging exhibit a good correlation with experimental data, confirming the accuracy of the model in both electrochemical and thermal aspects. Figure 6 illustrates the relationship between the anode potential and the battery expansion force with SOC during the charging process as simulated by the model. From Fig. 6, it can be observed that as the C-rate increases, the SOC where the anode potential is below 0 gradually decreases. When the overpotential becomes negative, lithium plating occurs. As shown in Fig. 6, the simulation results indicate that lithium plating occurs at SOC values of 62%, 43%, and 23% for charging rates of 1.0 C, 1.5 C, and 2.0 C, respectively.
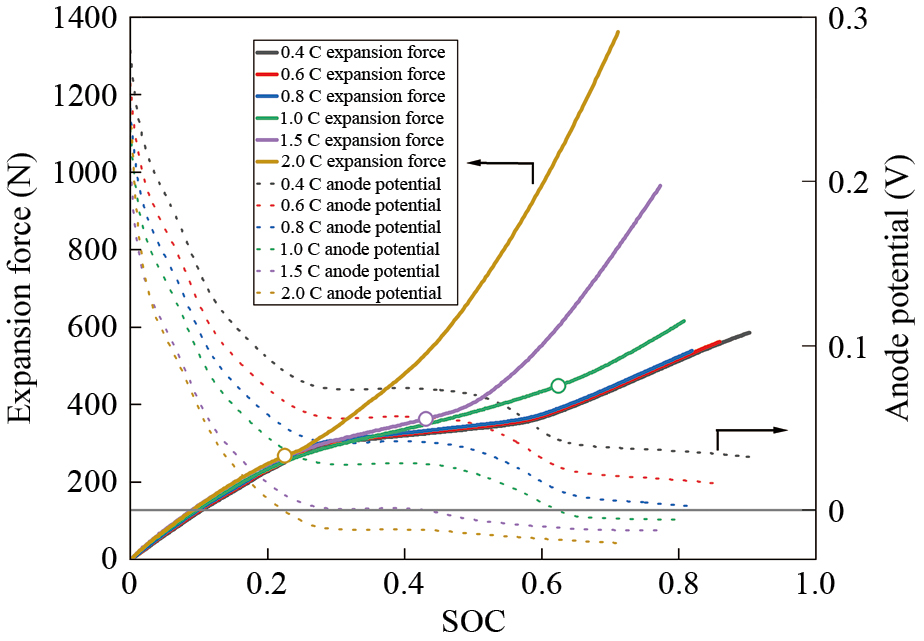
Based on the simulated overpotential results shown in Fig. 6 and the experimental expansion force shown in Fig. 7, no significant lithium plating is observed at 0.8 C, suggesting that at 0.8 C rate, only intercalation expansion and thermal expansion occur. Therefore, 0.4 C, 0.6 C, and 0.8 C are non-plating rates. Using the free expansion displacement at 0.2 C charging rate at 25 ℃ as the intercalation expansion displacement for non-plating rates, the expansion force and the thermal force are calculated as shown in Fig. 7. As observed in Fig. 7, during charging rates of 0.4 C, 0.6 C, and 0.8 C in which no significant lithium plating occurs, the battery expansion forces are similar, indicating that the maximum intercalation expansion forces are comparable at different rates. Meanwhile, it can be observed that the thermal expansion force is smaller compared to the intercalation expansion force. Due to the different stages of phase variations during the intercalation process in the graphite negative electrode material, the relationship curves between battery expansion and SOC are different at different charging rates, even in the absence of lithium plating and thermal expansion [42]. To better describe the change in the battery expansion force after lithium plating in the model, the expansion force at 0.8 C from experiments minus the thermal expansion force at this rate is used as the intercalation expansion force for charging rates of 1.0 C, 1.5 C, and 2.0 C. The intercalation expansion forces at different charging rates in Fig. 6 are calculated using the method described above. According to Eqs. (16) and (30), lithium plating leads to an increase in battery thickness and expansion force, which is evident in Fig. 6, where the battery expansion force shows an increasing trend after lithium plating occurs.
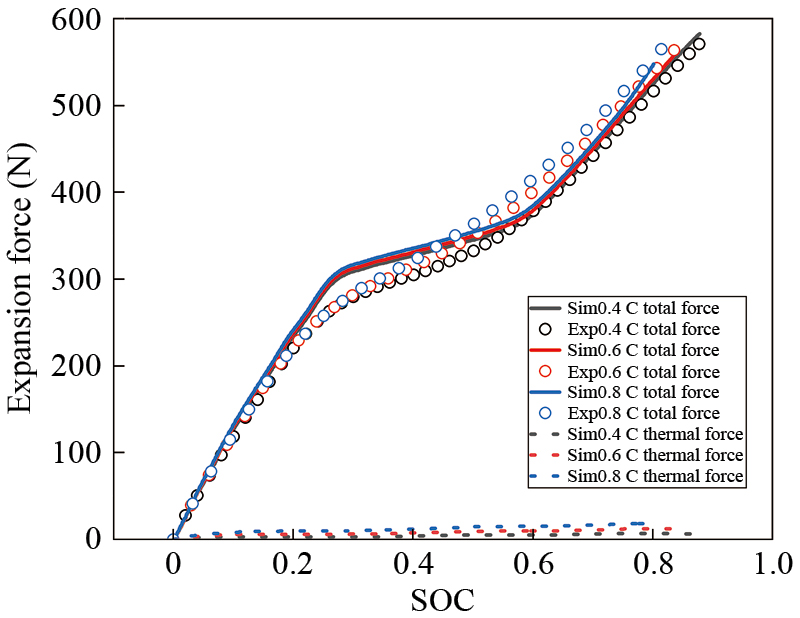
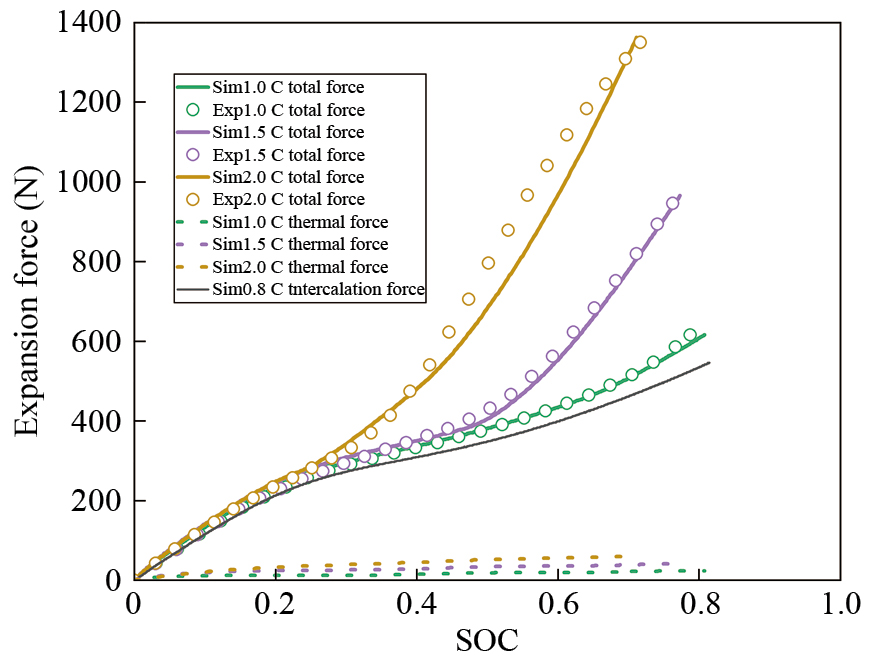
Figure 8 compares the simulated total expansion force and experimental data during charging rates of 1.0 C, 1.5 C, and 2.0 C, validating the accuracy of the simulated expansion force. During charging rates in which lithium plating occurs (1.0 C, 1.5 C, and 2.0 C), the battery expansion force shows abnormal increases beyond the intercalation expansion force after lithium plating begins. This is because, at higher charging rates (such as 2.0 C), both ohmic polarization and concentration polarization become significant, causing a rapid decrease in anode potential. When the anode potential drops below 0 V vs Li/Li+, lithium plating is triggered, and its growth is accelerated [43]. Meanwhile, high charging rates lead to insufficient lithium-ion diffusion rates in the anode, resulting in increased accumulation of lithium-ion on the surface and intensified lithium plating reactions, thereby increasing the thickness of the deposited layer. At low charging rates (e.g., below 1.0 C), lithium-ion has sufficient time to intercalate into the anode lattice, resulting in fewer free lithium ions accumulating on the surface and a lower probability of lithium plating. Even if lithium plating occurs (e.g., at 1.0 C), the deposited layer remains thin. Therefore, changes in expansion force can be used to analyze and predict the SOC at which lithium plating occurs in the battery.
The expansion force of intercalation and severe lithium plating is much greater than that of thermal expansion. Since the specific value of thermal expansion can be calculated, the magnitude of the expansion force of lithium plating can be obtained to determine whether the lithium plating occurs. The lithium plating expansion force was obtained by subtracting the thermal expansion force and intercalation expansion force from the total expansion force, as shown in Fig. 9. When the charge is finished, the proportion of each expansion force in the total expansion force from the simulation is shown in Table 4. As the charging rate increases, battery polarization increases while charge capacity decreases, leading to gradually lower SOC and reduced intercalation expansion force after the charge is finished. Higher charging rates result in increased battery heat generation and thermal expansion force. Meanwhile, the lithium plating expansion force increases more severely at high rates. At the 2.0 C rate, the lithium plating expansion force is approximately twice the intercalation expansion force at the same rate, accounting for 61.4% of the total expansion force. Therefore, for the CC charging process, when the total expansion force shows an abnormal increase beyond the sum of the thermal expansion force and intercalation expansion force, lithium plating can be considered to have occurred. The SOC at which the total expansion force exceeds the sum of thermal and intercalation expansion forces is defined as the lithium plating SOC.
MCC charging involves applying different constant currents at different charging stages. This method typically starts with a higher current and gradually reduces the charging current. Through the reasonable allocation of current at each stage, charging speed can be improved while suppressing lithium plating and reducing battery temperature rise, thereby achieving optimal charging performance. In this study, during 2.0 C constant current charging, the simulation results of expansion force and overpotential from Fig. 8 show that lithium plating occurs at 23% SOC. The maximum expansion force at 2.0 C charging reaches 1362 N, which is 2.3 times that of the non-plating 0.4 C rate. MCC charging can suppress lithium plating, reduce lithium plating expansion force, and simultaneously lower temperature rise and thermal expansion. Two-stage constant current charging is analyzed below to examine the advantages of multi-stage constant current charging and its impact on battery expansion force.
Assuming that plated lithium does not dissolve during charging, in Figs. 10(a) and 10(b), with the current variation point set at 50% SOC, compared to 2.0 C constant current charging, the 2.0 C to 1.5 C and 2.0 C to 1.0 C protocols result in battery expansion forces of 83% and 63% of the original value, temperature rises of 75% and 44% of the original value, and charging time increases of 17% and 52%, respectively. As shown in Fig. 6, lithium plating occurs at around 40% SOC during the 1.5 C constant current charging. For 1.5 C to 1.0 C charging with current variation points set at 50% and 60% SOC, since plated lithium does not dissolve during charging, the expansion force at charging completion with the 60% SOC variation point is greater than that with the 50% SOC variation point. The lithium plating endpoint appears when the current rates decrease. When the two-stage current is still high, lithium restarts plating after the plating endpoint, as shown in Fig. 10 (a).
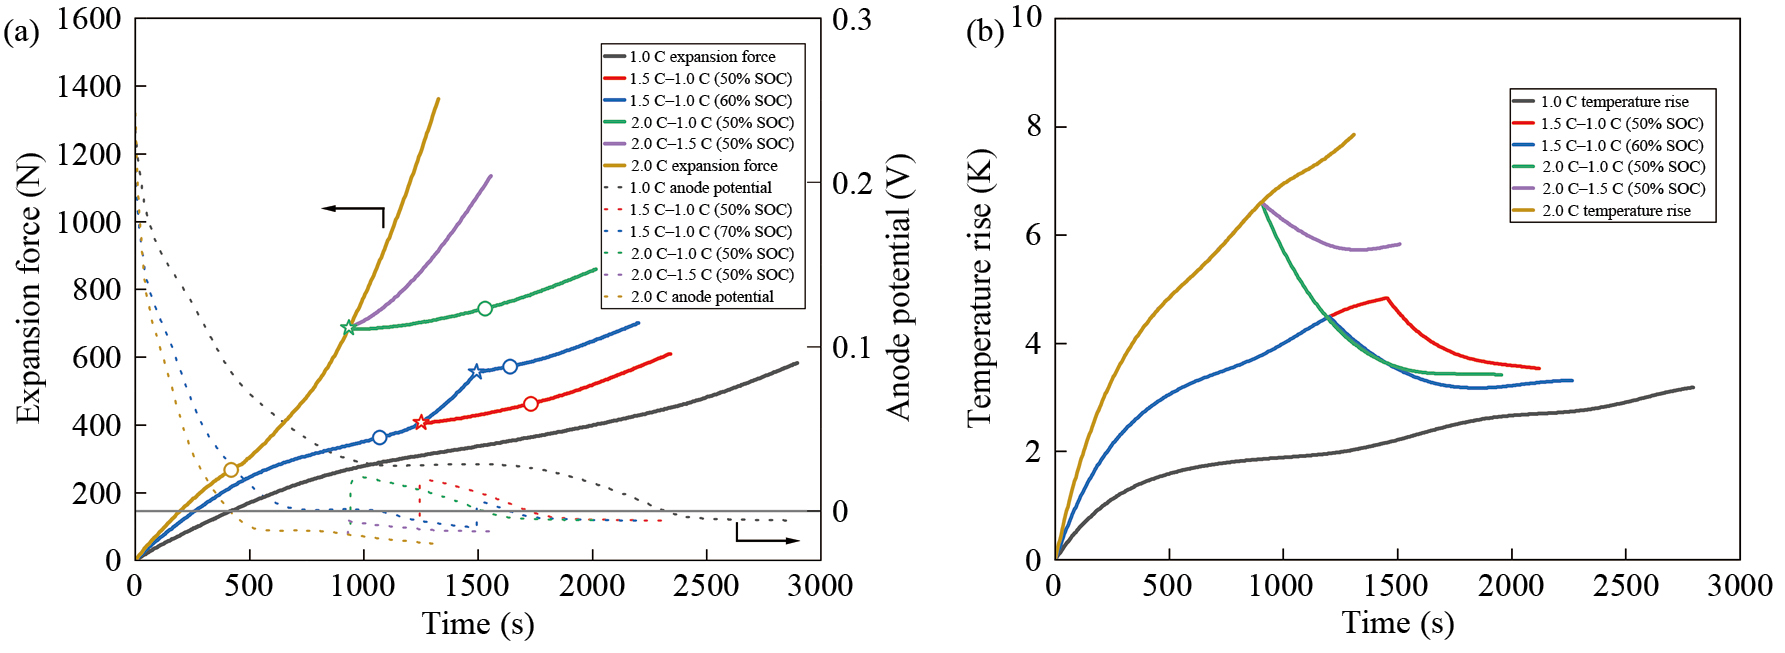
The reason MCC charging can reduce expansion force is that high current charging causes lithium plating. MCC charging reduces the current in later charging stages to minimize lithium plating and dendrite growth, thus reducing the expansion force caused by lithium plating. Meanwhile, the higher charging current leads to more significant Joule heating. MCC charging reduces current in stages to decrease overall heat generation, thereby lowering thermal expansion. During the actual charging process, after the current variation, the anode potential increases and may exceed the lithium plating equilibrium potential, leading to the dissolution of deposited lithium. The results in the actual expansion force is smaller than the simulation after the current variation.
Based on the analysis of two-stage constant current charging, variable current charging can effectively suppress lithium plating and reduce battery temperature rise. Therefore, establishing an appropriate multi-stage constant current charging strategy can effectively reduce battery lithium plating and expansion force while achieving faster charging for optimal charging performance. In the two-stage constant current charging model, when changing the charging current at 50% SOC from 2.0 C to 1.5 C and 2.0 C to 1.0 C, the battery expansion force remains relatively high, necessitating the development of a multi-stage variable current charging strategy. The variable current charging strategy uses battery SOC as the condition for current variation, requiring appropriate SOC points and suitable current rates.
Through model calculations of expansion forces at rates from 0.4 C to 2.0 C, the increment of expansion force for every 10% SOC increase was calculated. Lithium plating SOC of different C-rates was marked based on overpotential, as shown in Fig. 11. Ref. [42] shows that the expansion force at low charging rates is slightly higher than that at high charging rates during the initial charging period. Therefore, this paper uses the expansion displacement at 0.2 C as the intercalation expansion displacement at charging rates (0.4 C, 0.6 C, and 0.8 C), which will result in a slightly higher expansion force increment at these rates before 30% than at high rates (1.0 C–2.0 C), this can be observed in Fig. 11.
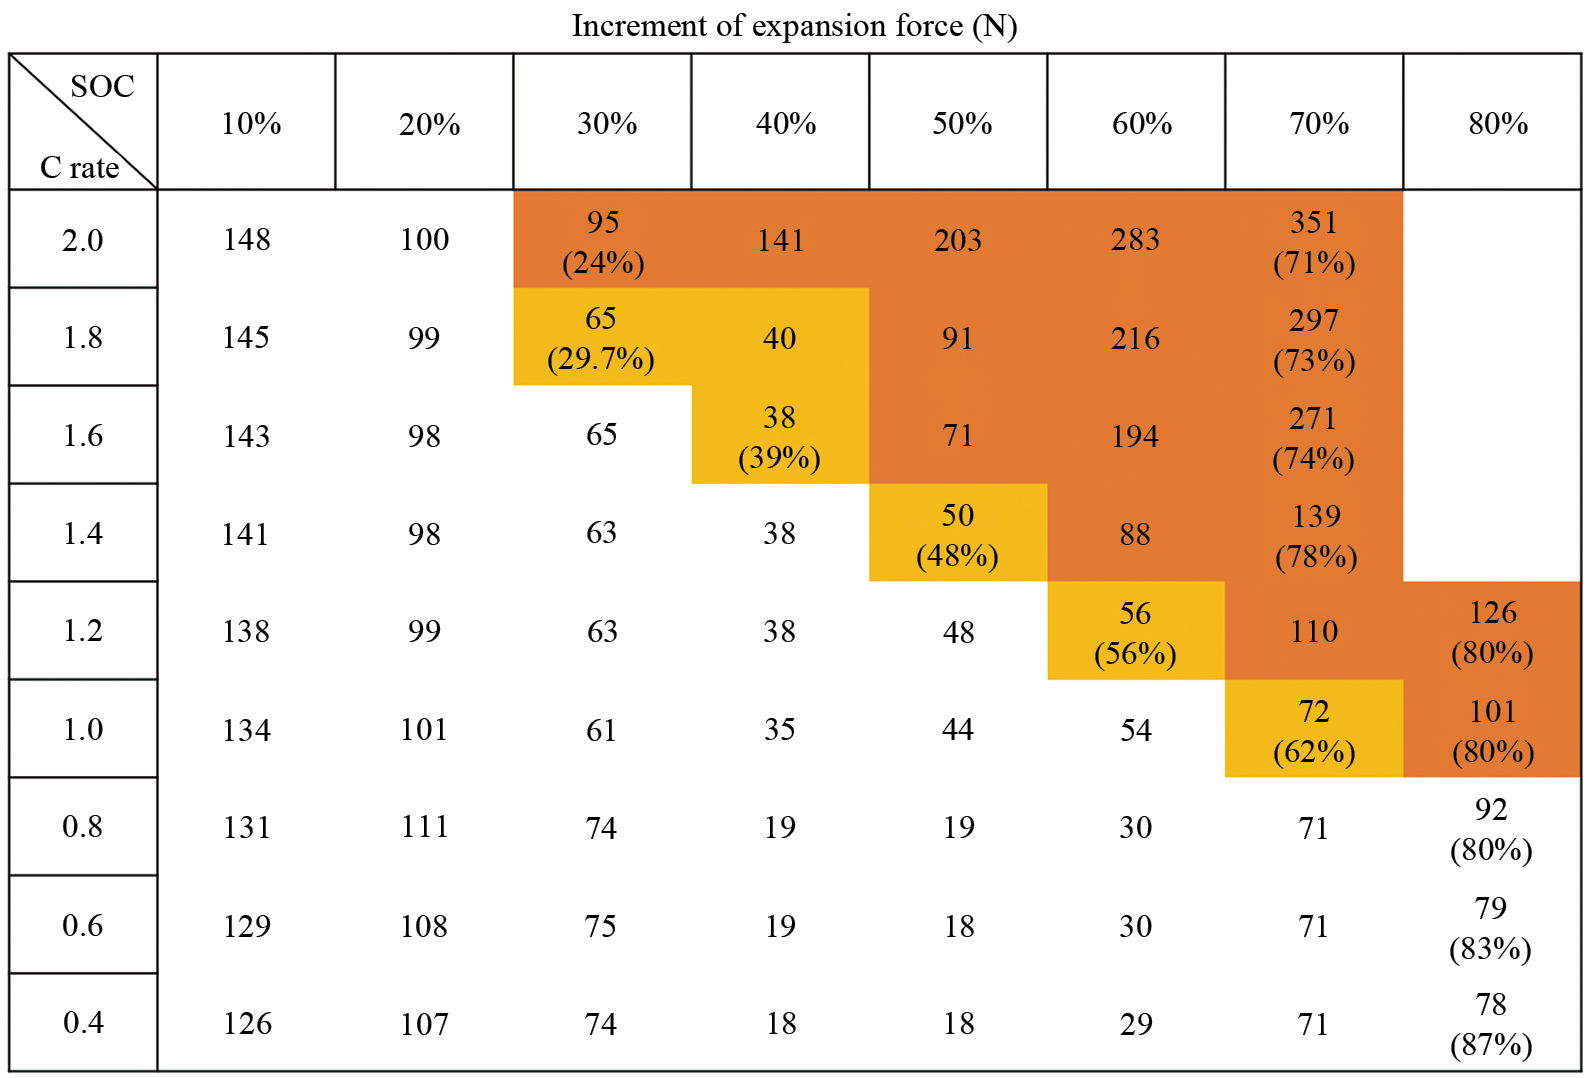
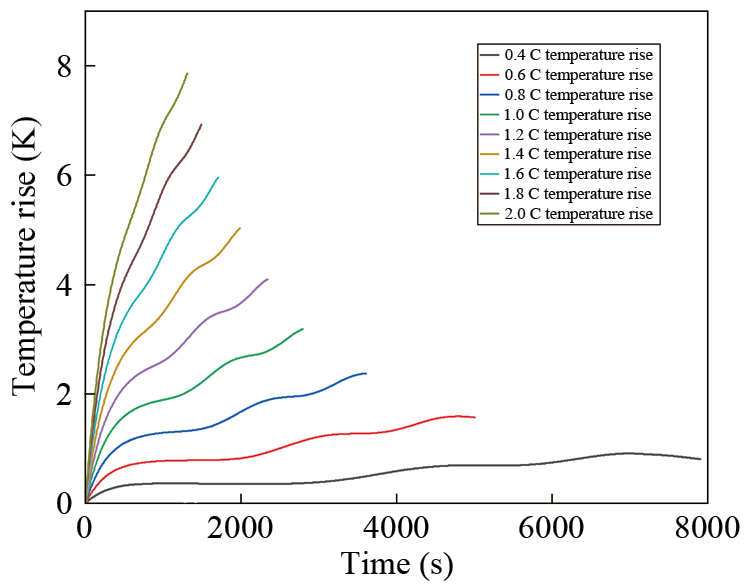
Since the difference in temperature rise of the battery between two adjacent rates is within 1 K as shown in Fig. 12, according to Eqs. (29) and (32), it is shown that the difference in thermal expansion force between two adjacent rates during battery charging is within 10 N. Therefore, if the difference between the expansion force increments in the 10% SOC range which the overpotential is below 0 and the expansion force increment under low-rate charging is within 10 N, it can be considered that the difference between the expansion force increments in the two adjacent rates is dominated by the thermal expansion force, and the expansion force increment only increases slightly. Since the overpotential indicates that the battery is lithium-plating, the battery is lithium-plating slightly at this time. If the difference is greater than 10 N compared to the low-rate expansion force, it can be considered that the effect of the lithium plating expansion force on the expansion force increment exceeds that of the thermal expansion force, and the expansion force increment increases significantly. At this time, if the battery continues to charge, severe lithium plating will occur.
The MCC charging strategy was developed based on the lithium plating SOC at different C-rates and the expansion force increments per 10% SOC increase. As shown in Fig. 11, when the differences in battery expansion force increments between different C-rates are minimal, it indicates that lithium plating has not occurred or the amount of lithium plating is negligible. When the expansion force in a 10% SOC interval shows significant growth compared to other C-rates, it indicates increased lithium plating, necessitating a current change. To maximize the charging speed while avoiding severe lithium plating, the charging strategy was set as follows: 2.0 C charging until 20% SOC, 1.8 C until 40% SOC, 1.4 C until 50% SOC, 1.2 C until 60% SOC, 1.0 C until 70% SOC, and finally 0.8 C until reaching the cut-off voltage of 4.25 V.
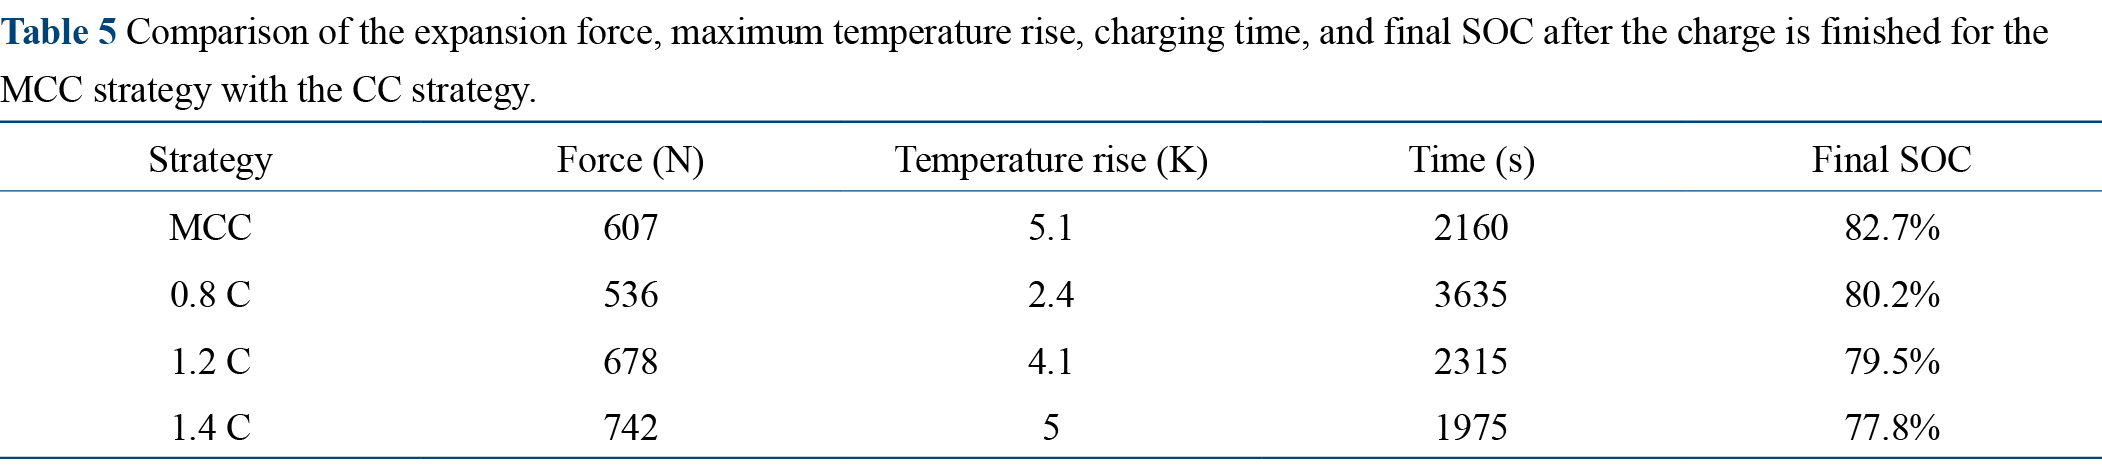
The charging current, battery expansion force, and temperature rise under this charging strategy are shown in Figs. 13(a) and 13(b). Under this MCC charging strategy, the maximum battery expansion force reaches 607 N, the highest temperature rise is 5.1 K, the charging duration is 2160 s, and the final charging SOC is 82.7%. The average charging rate of this MCC charging process is 1.36 C, and the constant current charging rate with a similar charging time to this MCC process is 1.2 C.
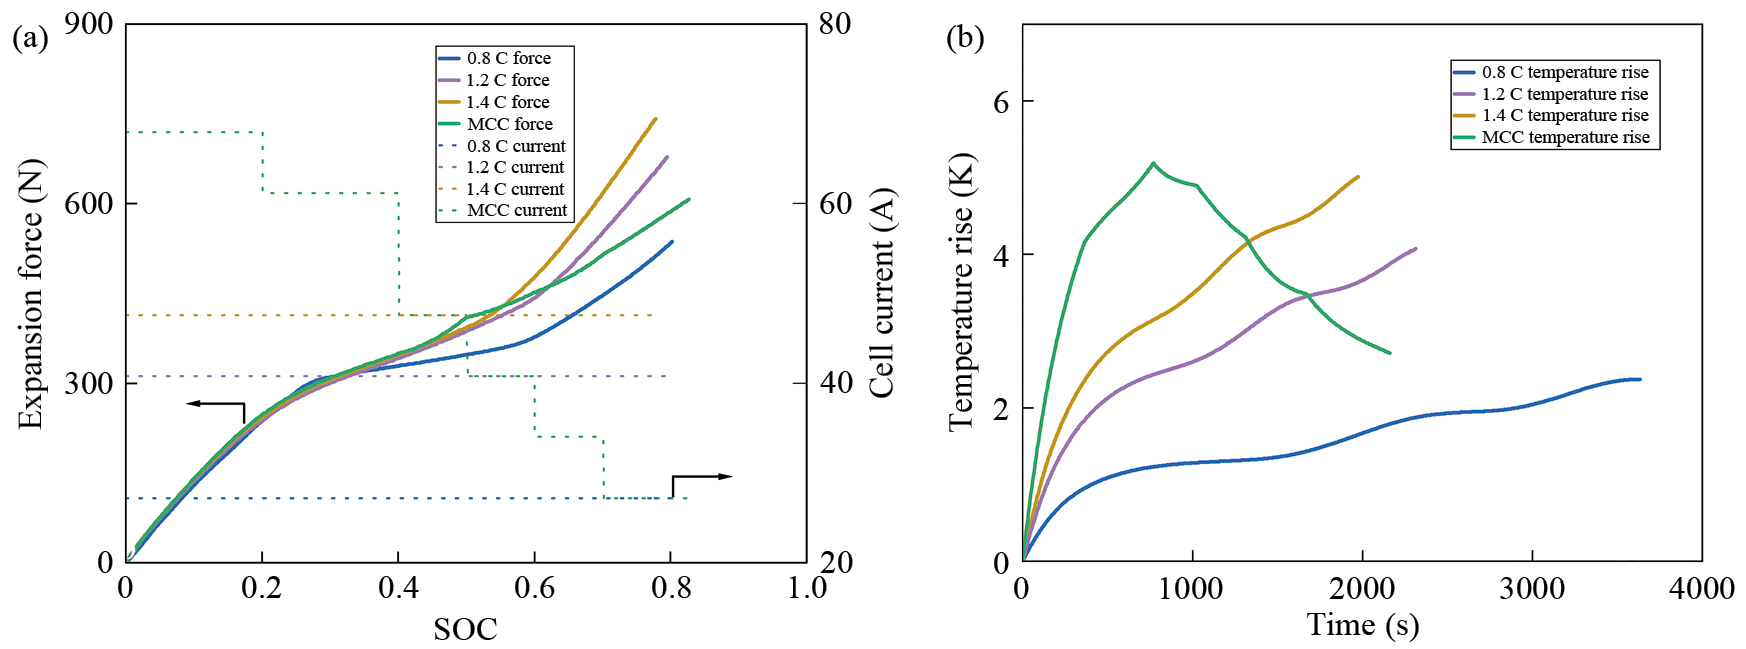
As shown in Table 5, compared to constant current charging at 1.2 C and 1.4 C, the MCC charging maintains a favorable temperature rise and charging duration while reducing expansion force and achieving higher final charging SOC. The expansion force under MCC charging increases by 70 N compared to the 0.8 C charging rate without lithium plating, while the previously calculated lithium plating expansion force at 1.5 C was 392 N. This significant reduction in expansion force indicates decreased lithium plating and reduced plating thickness during the MCC charging process. Meanwhile, MCC charging results in a higher final SOC, which reduces the time spent in the battery's final constant voltage charging stage.
Lithium-ion batteries' charging and discharging processes involve coupled electrochemical, thermal, and mechanical phenomena. High-rate constant current charging can lead to increased temperature rise and lithium plating, which causes battery volume expansion. Therefore, modeling and analyzing battery expansion force is of significant importance. This work demonstrates that battery expansion during charging consists of intercalation expansion, thermal expansion, and expansion caused by side reactions such as lithium plating. Battery expansion occurs at the micron scale and requires measurement with high-precision height gauges. Due to non-uniform lithium plating, battery expansion thickness measurements may be inaccurate. By constraining the battery in a three-layer plate and using the weighing sensor, battery expansion displacement can be converted to expansion force, facilitating the measurement while obtaining the lumped expansion force induced by lithium plating. Based on experiments, an electrochemical-thermal-mechanical coupling model considering lithium plating was established and validated. Analysis reveals that lithium plating is the main cause of the abnormal increase in expansion force. Therefore, the model can be used to analyze and measure lithium plating SOC under different charging rates, serving as a complement and guide to experiments that measure expansion force to predict plating without the need for reference electrode insertion or destructive analysis. The model was used to analyze the effects of variable current charging on battery expansion force, demonstrating that variable current can effectively suppress lithium plating and reduce battery temperature rise. An MCC strategy was developed and compared with constant current charging by analyzing the increment of the battery expansion force for every 10% SOC at different rates. The results indicate that adjusting the current through expansion force feedback control to avoid lithium plating while reducing battery temperature rise and expansion force is a viable charging strategy.
This work was financially supported by the National Natural Science Foundation of China (No. 52207242).
G. E. Blomgren, "The development and future of lithium ion batteries," Journal of The Electrochemical Society, vol. 164, no. 1, p. A5019, 2017.
F. M. N. U. Khan, M. G. Rasul, A. S. M. Sayem, and N. Mandal, "Maximizing energy density of lithium-ion batteries for electric vehicles: A critical review," Energy Reports, vol. 9, pp. 11–21, 2023.
J. Zhang, H. Huang, G. Zhang, Z. Dai, Y. Wen, and L. Jiang, "Cycle life studies of lithium-ion power batteries for electric vehicles: A review," Journal of Energy Storage, vol. 93, p. 112231, 2024.
M. Li, J. Lu, Z. Chen, and K. Amine, "30 years of lithium-ion batteries," Advanced Materials, vol. 30, no. 33, p. 1800561, 2018.
B. Scrosati and J. Garche, "Lithium batteries: Status, prospects and future," Journal of Power Sources, vol. 195, no. 9, pp. 2419–2430, 2010.
H. Sun, W. Tian, J. Yue, and F. Su, "Lithium-ion battery heterogeneous electrochemical-thermal-mechanical multiphysics coupling model and characterization of microscopic properties," Journal of Power Sources, vol. 629, p. 235970, 2025.
W. Ai, L. Kraft, J. Sturm, A. Jossen, and B. Wu, "Electrochemical thermal-mechanical modelling of stress inhomogeneity in lithium-ion pouch cells," Journal of The Electrochemical Society, vol. 167, no. 1, p. 013512, 2020.
P. Luo, P. Li, D. Ma, K. Wang, and H. Zhang, "Coupled electrochemical-thermal-mechanical modeling and simulation of lithium-ion batteries," Journal of the Electrochemical Society, vol. 169, p. 100535, 2022.
D. R. Baker and M. W. Verbrugge, "Modeling overcharge at graphite electrodes: Plating and dissolution of lithium," Journal of The Electrochemical Society, vol. 167, no. 1, p. 013504, 2020.
Y. Tian, C. Lin, X. Chen, X. Yu, R. Xiong, and Q. Zhang, "Reversible lithium plating on working anodes enhances fast charging capability in low-temperature lithium-ion batteries," Energy Storage Materials, vol. 56, pp. 412–423, 2023.
A. Adam, J. Wandt, E. Knobbe, G. Bauer, and A. Kwade, "Fast-charging of automotive lithium-ion cells: In-situ lithium-plating detection and comparison of different cell designs," Journal of the Electrochemical Society, vol. 167, p. 130503, 2020.
H. Yu, L. Wang, Z. Zhang, Y. Li, S. Yang, and X. He, "Insight understanding of external pressure on lithium plating in commercial lithium-ion batteries," Advanced Functional Materials, vol. 34, no. 42, p. 2406966, 2024.
U. R. Koleti, A. Rajan, C. Tan, S. Moharana, T. Q. Dinh, and J. Marco, "A study on the influence of lithium plating on battery degradation," Energies, vol. 13, no. 13, p. 3458, 2020.
J. Deng, X. Yang, and G. Zhang, "Simulation study on internal short circuit of lithium ion battery caused by lithium dendrite," Materials Today Communications, vol. 31, p. 103570, 2022.
B. Liu, Y. Jia, C. Yuan, L. Wang, X. Gao, S. Yin, and J. Xu, "Safety issues and mechanisms of lithium-ion battery cell upon mechanical abusive loading: A review," Energy Storage Materials, vol. 24, pp. 85–112, 2020.
B. Jiang, S. Tao, X. Wang, J. Zhu, X. Wei, and H. Dai, "Mechanics-based state of charge estimation for lithium-ion pouch battery using deep learning technique," Energy, vol. 278, p. 127890, 2023.
Y. Chen, Y. Kang, Y. Zhao, L. Wang, J. Liu, Y. Li, Z. Liang, X. He, X. Li, N. Tavajohi et al., "A review of lithium-ion battery safety concerns: The issues, strategies, and testing standards," Journal of Energy Chemistry, vol. 59, pp. 83–99, 2021.
T. Krause, D. Nusko, L. P. Bauermann, M. Vetter, M. Schäfer, and C. Holly, "Methods for quantifying expansion in lithium-ion battery cells resulting from cycling: A review," Energies, vol. 17, no. 7, p. 1566, 2024.
W. Mei, Q. Duan, W. Lu, J. Sun, and Q. Wang, "An investigation on expansion behavior of lithium ion battery based on the thermal-mechanical coupling model," Journal of Cleaner Production, vol. 274, p. 122643, 2020.
H. Yu, L. Wang, Z. Zhang, Y. Li, S. Yang, and X. He, "Insight understanding of external pressure on lithium plating in commercial lithium-ion batteries," Advanced Functional Materials, vol. 34, no. 42, p. 2406966, 2024.
A. Tokranov, R. Kumar, C. Li, S. Minne, X. Xiao, and B. W. Sheldon, "Control and optimization of the electrochemical and mechanical properties of the solid electrolyte interphase on silicon electrodes in lithium ion batteries," Advanced Energy Materials, vol. 6, no. 8, p. 1502302, 2016.
T. Bond, J. Zhou, and J. Cutler, "Electrode stack geometry changes during gas evolution in pouch-cell-type lithium ion batteries," Journal of the Electrochemical Society, vol. 164, pp. A6158–A6162, 2017.
J. Gu, Z. Liang, J. Shi, and Y. Yang, "Electrochemo-mechanical stresses and their measurements in sulfide-based all-solid-state batteries: A review," Advanced Energy Materials, vol. 13, no. 2, p. 2203153, 2023.
K.-Y. Oh and B. I. Epureanu, "Characterization and modeling of the thermal mechanics of lithium-ion battery cells," Applied Energy, vol. 178, pp. 633–646, 2016.
S. Wang, D. Ren, C. Xu, X. Han, X. Liu, L. Lu, and M. Ouyang, "Lithium plating induced volume expansion overshoot of lithium-ion batteries: Experimental analysis and modeling," Journal of Power Sources, vol. 593, p. 233946, 2024.
K. Yu, A. M. Adeyinka, S.-Y. Choe, and W. Lee, "Optimized multi-stage constant current fast charging protocol suppressing lithium plating for lithium-ion batteries using reduced order electrochemical-thermal-life model," Journal of Power Sources, vol. 626, p. 235759, 2025.
F. An, R. Zhang, Z. Wei, and P. Li, "Multi-stage constant-current charging protocol for a high-energy-density pouch cell based on a 622NCM/graphite system," RSC Advances, vol. 9, no. 37, pp. 21498–21506, 2019.
Y. Wang, R. Ni, X. Jiang, M. Yin, D. Zhang, and Z. Xie, "An electrochemical-mechanical coupled multi-scale modeling method and full-field stress distribution of lithium-ion battery," Applied Energy, vol. 347, p. 121444, 2023.
M. U. Tahir, A. Sangwongwanich, D. I. Stroe, and F. Blaabjerg, "The effect of multi-stage constant current charging on lithium-ion battery's performance," CPE-PowerEng 2023— 17th IEEE International Conference on Compatibility, Power Electronics and Power Engineering, Tallinn, Estonia, 14–16 June 2023.
X. Wu, Y. Xia, J. Du, X. Gao, and S. Nikolay, "Multistage constant current charging strategy based on multiobjective current optimization," IEEE Transactions on Transportation Electrification, vol. 9, no. 4, pp. 4990–5001, 2023.
Y. Shen, X. Wang, Z. Jiang, B. Luo, D. Chen, X. Wei, and H. Dai, "Online detection of lithium plating onset during constant and multistage constant current fast charging for lithium-ion batteries," Applied Energy, vol. 370, p. 123631, 2024.
M. Doyle, T. F. Fuller, and J. Newman, "Modeling of galvanostatic charge and discharge of the lithium/polymer/insertion cell," Journal of The Electrochemical Society, vol. 140, no. 6, p. 1526, 1993.
M. Doyle, J. Newman, A. S. Gozdz, C. N. Schmutz, and J. M. Tarascon, "Comparison of modeling predictions with experimental data from plastic lithium ion cells," Journal of The Electrochemical Society, vol. 143, no. 6, p. 1890, 1996.
X. Zhang, W. Shyy, and A. Marie Sastry, "Numerical simulation of intercalation-induced stress in Li-ion battery electrode particles," Journal of the Electrochemical Society, vol. 154, no. 10, pp. A910–A916, 2007.
W. Mei, H. Chen, J. Sun, and Q. Wang, "Numerical study on tab dimension optimization of lithium-ion battery from the thermal safety perspective," Applied Thermal Engineering, vol. 142, pp. 148–165, 2018.
P. Arora, M. Doyle, and R. E. White, "Mathematical modeling of the lithium deposition overcharge reaction in lithium-ion batteries using carbon-based negative electrodes," Journal of the Electrochemical Society, vol. 146, no. 10, pp. 3543–3553, 1999.
W. Mei, L. Zhang, J. Sun, and Q. Wang, "Experimental and numerical methods to investigate the overcharge caused lithium plating for lithium ion battery," Energy Storage Materials, vol. 32, pp. 91–104, 2020.
J. Cai, X. Wei, X. Wang, J. Zhu, B. Jiang, Z. Tao, M. Tian, and H. Dai, "Revealing effects of pouch Li-ion battery structure on fast charging ability through numerical simulation," Applied Energy, vol. 377, p. 124438, 2025.
S. Goutam, A. Nikolian, J. Jaguemont, J. Smekens, N. Omar, P. Van Dan Bossche, and J. Van Mierlo, "Three-dimensional electro-thermal model of li-ion pouch cell: Analysis and comparison of cell design factors and model assumptions," Applied Thermal Engineering, vol. 126, pp. 796–808, 2017.
E. Schuster, C. Ziebert, A. Melcher, M. Rohde, and H. J. Seifert, "Thermal behavior and electrochemical heat generation in a commercial 40 A·h lithium ion pouch cell," Journal of Power Sources, vol. 286, pp. 580–589, 2015.
I. Baghdadi, O. Briat, A. Eddahech, J. M. Vinassa, and P. Gyan, "Electro-thermal model of lithium-ion batteries for electrified vehicles applications," 2015 IEEE 24th International Symposium on Industrial Electronics (ISIE), Buzios, Brazil, 03–05 June 2015, p. 1248–1252.
D. Clerici, F. Mocera, and A. Somà, "Electrochemical–mechanical multi-scale model and validation with thickness change measurements in prismatic lithium-ion batteries," Journal of Power Sources, vol. 542, p. 231735, 2022.
 Top
Top