ContentsFigures & Tables
Global sales of new energy vehicles (NEVs) increase by 63.6% in 2022 to reach 10.65 million units and exhibit no signs of slowing this year, according to new data from the market research firm Trend Force [1, 2]. The widespread adoption of lithium-ion batteries as the main power source owing to in NEVs have been attributed to their notable advantages, including a low self-discharge rate, an extended cycle life, and excellent charge-discharge performance [3–6]. One of the longstanding limitations that jeopardize the safety performance of lithium-ion batteries is the remaining charging time, which is primarily reflected by the overcharging and undercharging of the battery, causing irreversible effects on the battery. However, overcharging batteries commonly causes fire disasters [7], explosion accidents [8], and even severe danger to personal and property safety [9]. Undercharging the battery can lead to a decrease in its capacity and a shorter lifespan. Therefore, it is crucial to accurately estimate the RCT to ensure that batteries operate safely and reliably. [10–14]. In addition, it aids in easing the problems with users' practical travel arrangements as well as the scheduling difficulties of public charging stations caused by inadequate supporting facilities.
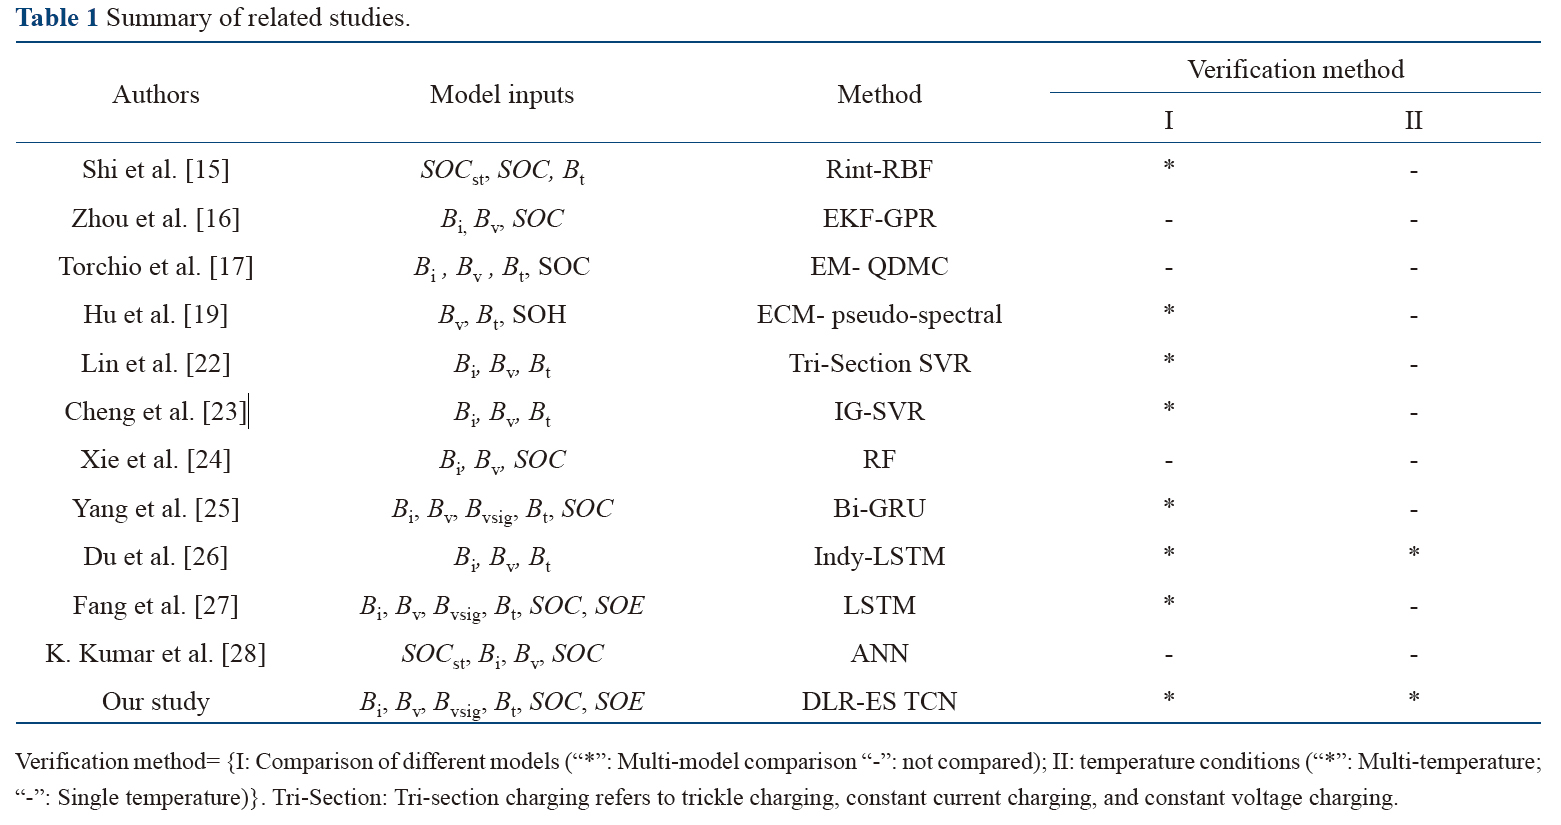
Hence, to improve the safety performance and prolong the cycle life of batteries, many scholars have researched the remaining battery charging time, as shown in Table 1. The estimation methods for battery RCT can be broadly categorized into two mainstreams, namely model-based and data-driven approaches.
| Authors | Model inputs | Method | Verification method | |
|---|---|---|---|---|
| I | II | |||
| Shi et al. [15] | SOCst, SOC, Bt | Rint-RBF | * | - |
| Zhou et al. [16] | Bi,Bv, SOC | EKF-GPR | - | - |
| Torchio et al. [17] | Bi, Bv, Bt, SOC | EM- QDMC | - | - |
| Hu et al. [19] | Bv, Bt, SOH | ECM- pseudo-spectral | * | - |
| Lin et al. [22] | Bi, Bv, Bt | Tri-Section SVR | * | - |
| Cheng et al. [23] | Bi, Bv, Bt | IG-SVR | * | - |
| Xie et al. [24] | Bi, Bv, SOC | RF | - | - |
| Yang et al. [25] | Bi, Bv, Bvsig, Bt, SOC | Bi-GRU | * | - |
| Du et al. [26] | Bi, Bv, Bt | Indy-LSTM | * | * |
| Fang et al. [27] | Bi, Bv, Bvsig, Bt, SOC, SOE | LSTM | * | - |
| K. Kumar et al. [28] | SOCst, Bi, Bv, SOC | ANN | - | - |
| Our study | Bi, Bv, Bvsig, Bt, SOC, SOE | DLR-ES TCN | * | * |
Model-based methods typically include electrochemical and empirical models and the equivalent circuit model (ECM). Shi et al. [15] proposed a real-time RCT estimation algorithm for an electric vehicle battery based on charging accuracy and charging profile. For the constant current (CC) charging stage, a random CT algorithm is proposed for online charging accuracy. In the constant voltage (CV) stage, the battery Rint model is combined with a radial basis function (RBF) neural network to predict the future current profile in the CV stage. The CT calculations for each stage are then performed to estimate the RCT. Zhou et al. [16] developed a model for battery state of health (SOH) based on charging capacity, which was then converted into the time required for full charge of the battery. They proposed an algorithm to estimate the full charge time using the extended Kalman filter (EKF) and Gaussian process regression (GPR), effectively addressing the challenge of predicting full charge time through piece-charging. Torchio et al. [17] developed a method of combining a pseudo-two-dimensional model (P2D) based on an electrochemical model with quadratic dynamic matrix control (QDMC). The charging time was minimized by considering voltage and temperature constraints. Abdollah et al. [18] optimized the charging curve of constant current and constant voltage (CC-CV) based on a battery internal resistance model using a weighted sum objective function that incorporates time-to-charge (TTC), energy loss (EL), and temperature rise index (TRI) in order to achieve an optimal charging solution. Hu et al. [19] used an equivalent circuit model and pseudo-spectral technology to reduce the charging time and energy loss. Trentadue et al. [20] studied the efficiency of fast charging electric vehicles under extreme temperature conditions and the effects of different fast charging piles and combined charging systems on charging efficiency. Nazghelichil et al. [21] introduced a method combining an electrochemical model and linear stability analysis of lead-acid batteries. The charging voltage is increased and the charging time was shortened to maintain system stability. Although model-based methods are commonly used for RCT estimation, the use of model estimation in actual scenarios is affected by data noise, resulting in an estimation accuracy that is not sufficiently high. In addition, a charging process of the battery is a dynamic process, which increases the difficulty of RCT estimation.
Recently, the development of artificial intelligence (AI) technology has led to the widespread use of data-driven methods for estimating battery RCT. This method does not require a complex physical model but uses the time series characteristics related to the RCT in the monitoring data to establish a nonlinear model to map the relationship between the battery charging curve and RCT. Data-driven methods include machine learning and deep learning. The application of machine learning in battery RCT, primarily includes support vector regression (SVR) [22, 23], Gaussian process regression (GPR) [16], and random forest (RF) [24]. However, machine learning methods have high requirements for training data, high computational costs, poor generalization ability, and a lack of stability. Compared with machine learning, deep learning is more versatile. It can directly use the original time-series features as input data for the model. Additionally, a model can automatically extract the deep features between the data, and the generalization ability is strong. Yang et al. [25] developed a method to estimate the RCT of Bi-GRU trams by utilizing input characteristic parameters such as current, voltage, and temperature. Du et al. [26] used an independent long short-term memory neural network (Indy-LSTM) to predict a lithium battery RCT and discussed the hyperparameters of the model. Fang et al.[27] discussed the estimation of RCT based on the LSTM model in detail. Kumar et al. [28] introduced an artificial neural network (ANN) model for the prediction of charging profiles, utilizing inputs such as the previous charging profile, initial state of charge (SOC), and final SOC to accurately predict the current charging profile of electric vehicles.
However, the deep learning-based methods adopt the static learning rate (SLR) mechanism for RCT estimation. During the training process, the model may fall into a local optimum, and its generalization ability may decrease. Most studies have focused only on one charging scenario. Some researchers have adopted a dynamic learning rate (DLR) mechanism for battery state estimation based on deep learning methods. For example, Ma et al. [29], Chai et al. [30], and Sun et al. [31] verified this mechanism in predicting battery SOH, remaining useful life (RUL), and photovoltaic output powers of batteries. In addition, to prevent the over fitting of a model, Liu et al. [32] adopted a method of combining the learning rate reduction mechanism with an early termination strategy to estimate the SOC of lithium-ion batteries. However, the learning rate reduction mechanism adopted by the author in the model only decreases the learning rate when the learning stagnates, which increases the training time and calculation cost.
In summary, previous studies have primarily focused on experiments involving cell batteries and specific charging states, while with limited consideration to the influence of charging scenarios and strategies on the remaining charging time. However, during actual charging processes, variations in external temperature and charging strategies can lead to differences in the charging process even for batteries of the same type, resulting in changes to the remaining charging time. This is evident through fluctuations in internal battery temperature and charging current, which impact the speed of battery recharging and subsequently affect its remaining charge time. Furthermore, interval charging is often employed to extend battery life. Different interval charges can also affect the remaining charge time. Therefore, an estimation model for remaining charge time should possess not only high precision but also strong generalization ability and stability to accommodate multi-scenario charging[33]. To address the problems in the above methods, we use a deep learning model based on learning rate decay, namely, a temporal convolutional network (TCN) model with a DLR mechanism and early stopping (ES) strategy fusion. A new RCT estimation framework based on deep learning is proposed. The aim of this framework is to apply RCT estimation to multi-scenario charging data, and it can well balance the relationship between the model convergence speed and accuracy. The specific contributions of this study are as follows:
(1) Leveraged DLR mechanisms and ES are designed to improve the training process, avoid overfitting, and improve the generalizability and reliability of the model.
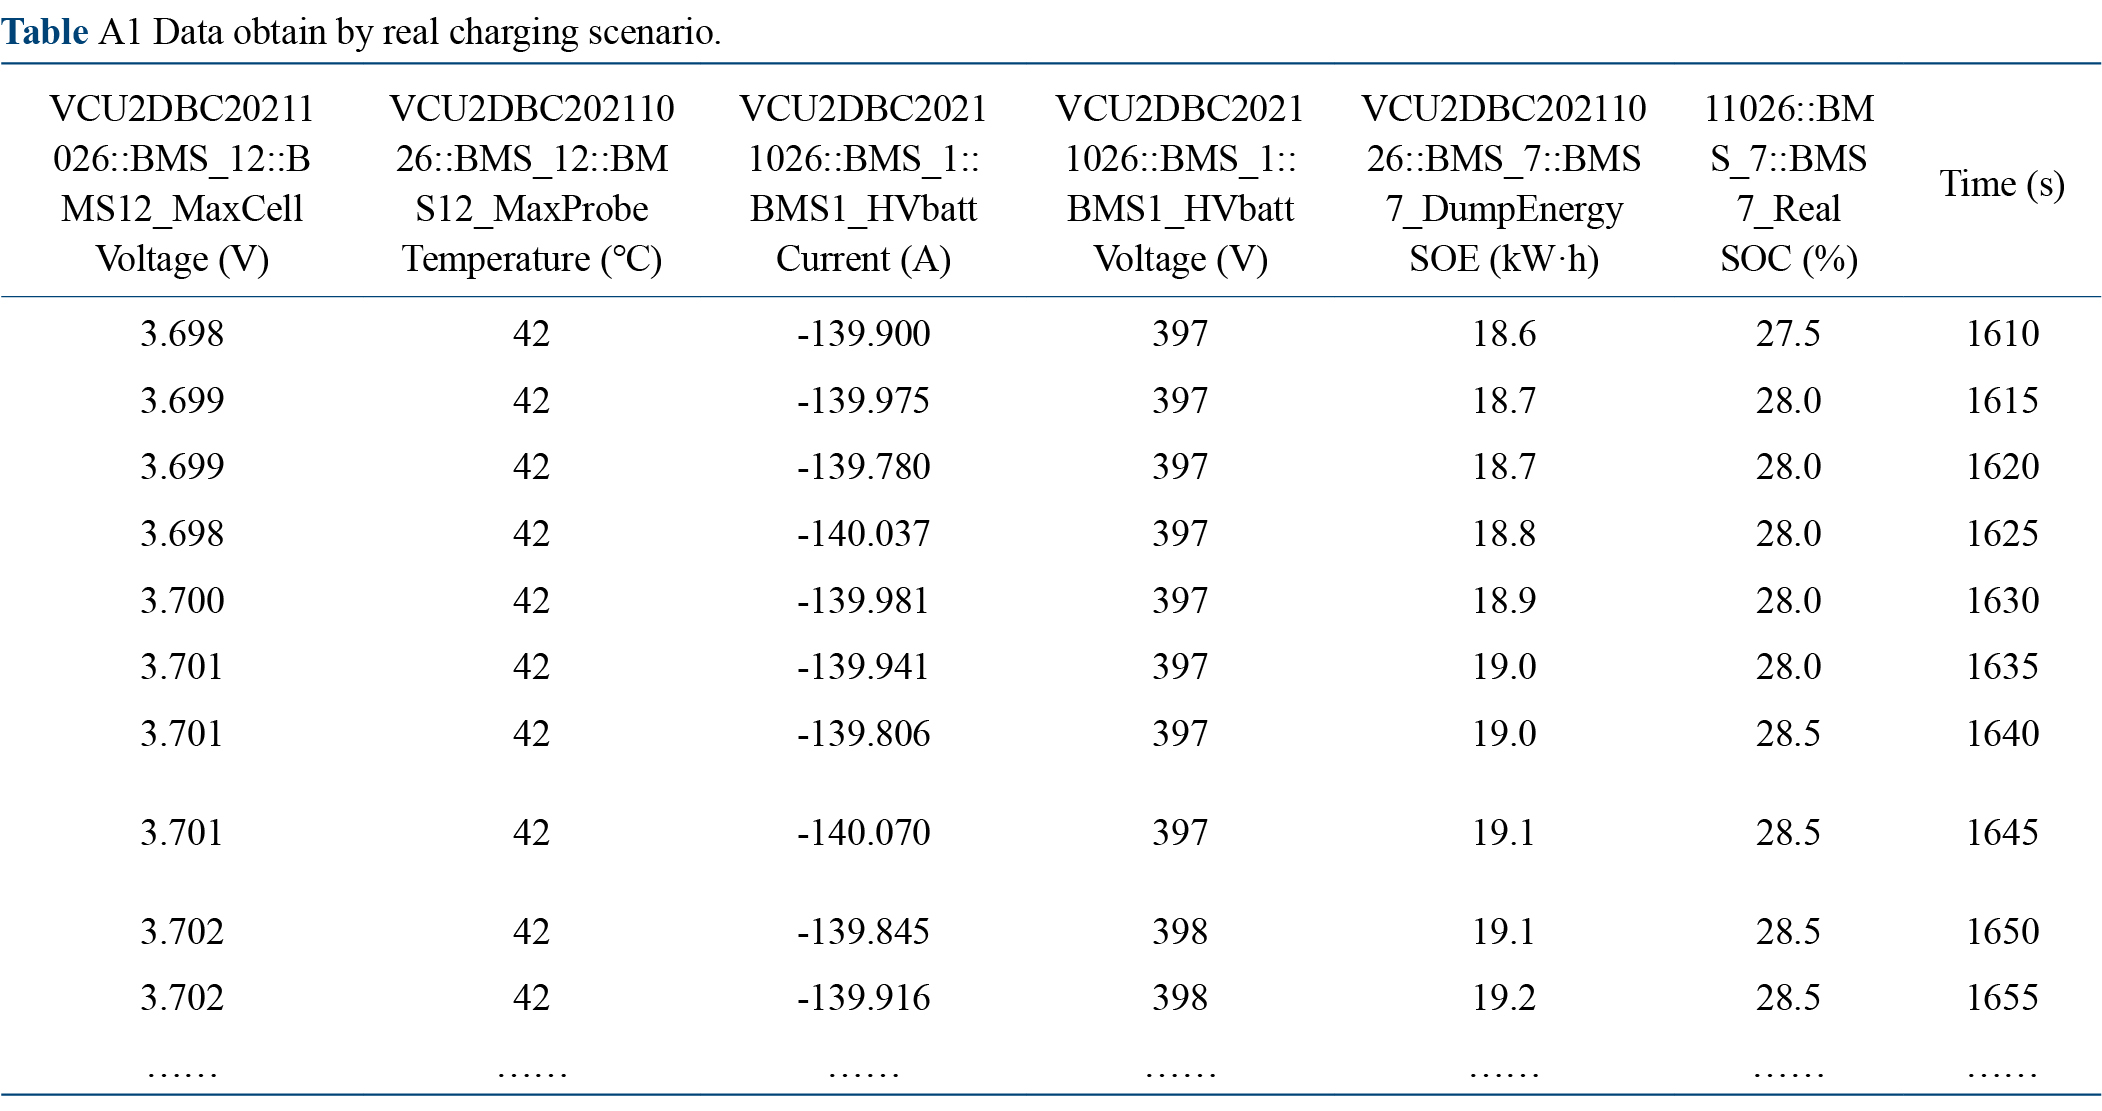
(2) The charging data of a lithium-ion battery in an actual environment were collected, and the charging curve was analyzed. The model used the extracted cell voltage, cell temperature, charging current, voltage, SOC, and state of energy (SOE) as the input data set, while the target data was the RCT[34].
(3) The proposed model of generalization and robustness have been verified under different charging environments, optimal charging thresholds, and charging strategies. The model can handle RCT estimation in the most complex scenarios. In addition, compared with several data-driven methods, this study proved that the proposed has better accuracy and robustness.
The remainder of this paper is organized as follows: Section 2 describes charging tests for different charging scenarios. Section 3 introduces the proposed estimation model and process. Section 4 analyzes and discusses the results of different scenarios and methods. Section 5 summarizes the findings and future research directions.
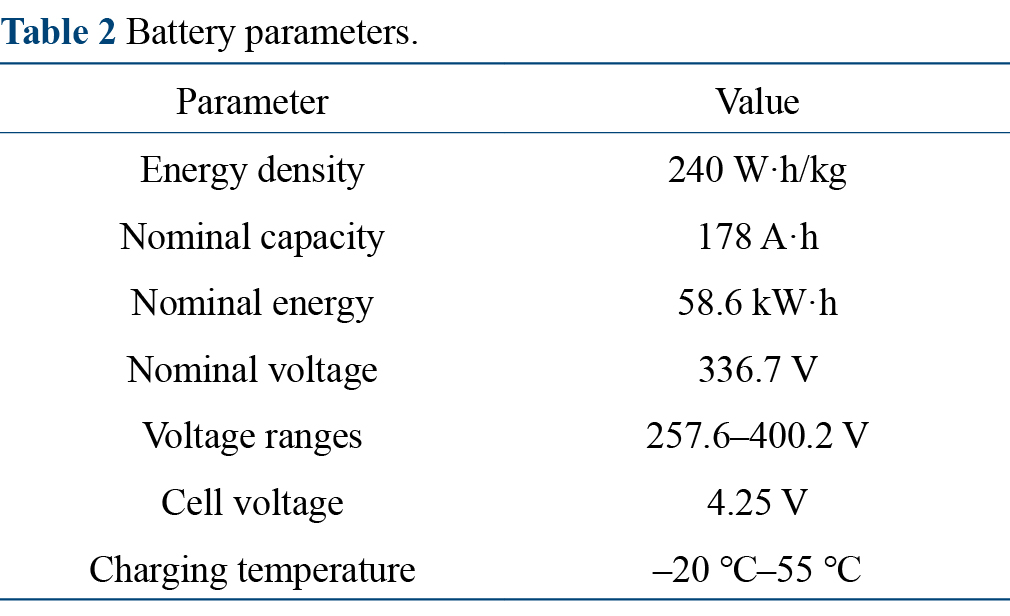
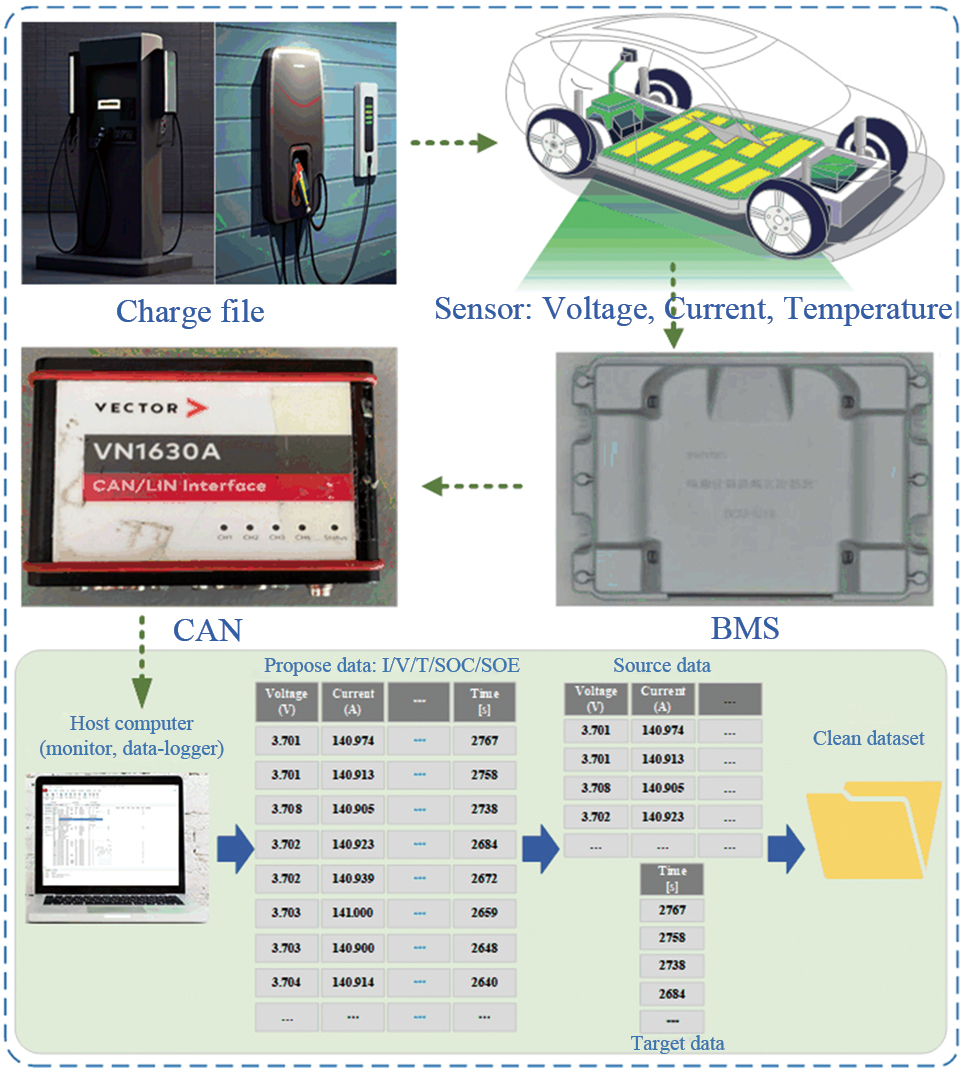
A ternary lithium-ion battery was tested to validate the proposed RCT estimation method. The basic battery parameters are listed in Table 2. To acquire the experimental data on the current, voltage, and temperature, we established a power battery charging test bench. The configuration of the test bench is shown in Fig. 1, which consisted of a 120 kW DC charging pile (7 kW AC charging pile), a battery management system (BMS), a controller area network (CAN) communication unit, a computer for storing experimental data, and some test cells. The charging pile was used to load current on the test cells, and the measurement accuracy of current and voltage was ± 0.1%. Experimental data such as charging the current, charging voltage, and cell temperature, were measured using the BMS and stored on a host computer. All experimental data were collected using the CANoe software and used as input data for the estimation model.
Before the charging test, the battery was first discharged to an SOC of < 5% (25%) under urban conditions. Second, close the positive temperature coefficient (PTC), the test sample was placed under high pressure, placed under the test temperature, and then left for 30 min for the battery to reach a steady state. The computer was then connected to an electric vehicle to be charged through the CAN communication unit. Finally, the charging gun was inserted into the charging port of the electric vehicle, and the charging pile was initiated by swiping the card for the charging test until the charging cut off voltage was reached. This process was repeated under various charging conditions.
To investigate the RCT of the battery at different temperatures, we conducted a full charge test of the battery at outdoor temperatures of –20, 25, and 40 °C. Figure 2 shows the charging curves of the battery at different temperatures. The overall trend of the charging current decreased stepwise. When the external temperature was 25 °C, as shown in Fig. 2 (a), the initial charging current was about 140 A, and the internal temperature of the battery pack began to increase gradually. When the internal temperature of the battery reached the highest temperature of 38 °C, the charging current began to decrease in a stepwise manner. When the battery SOC was 70%, the battery was still at its highest temperature, the current was reduced stepwise again, and the internal temperature of the battery gradually decreased. When SOC = 95%, it takes 5227 s were required to reduce to the minimum current and charge to the completion of charging with the minimum current.
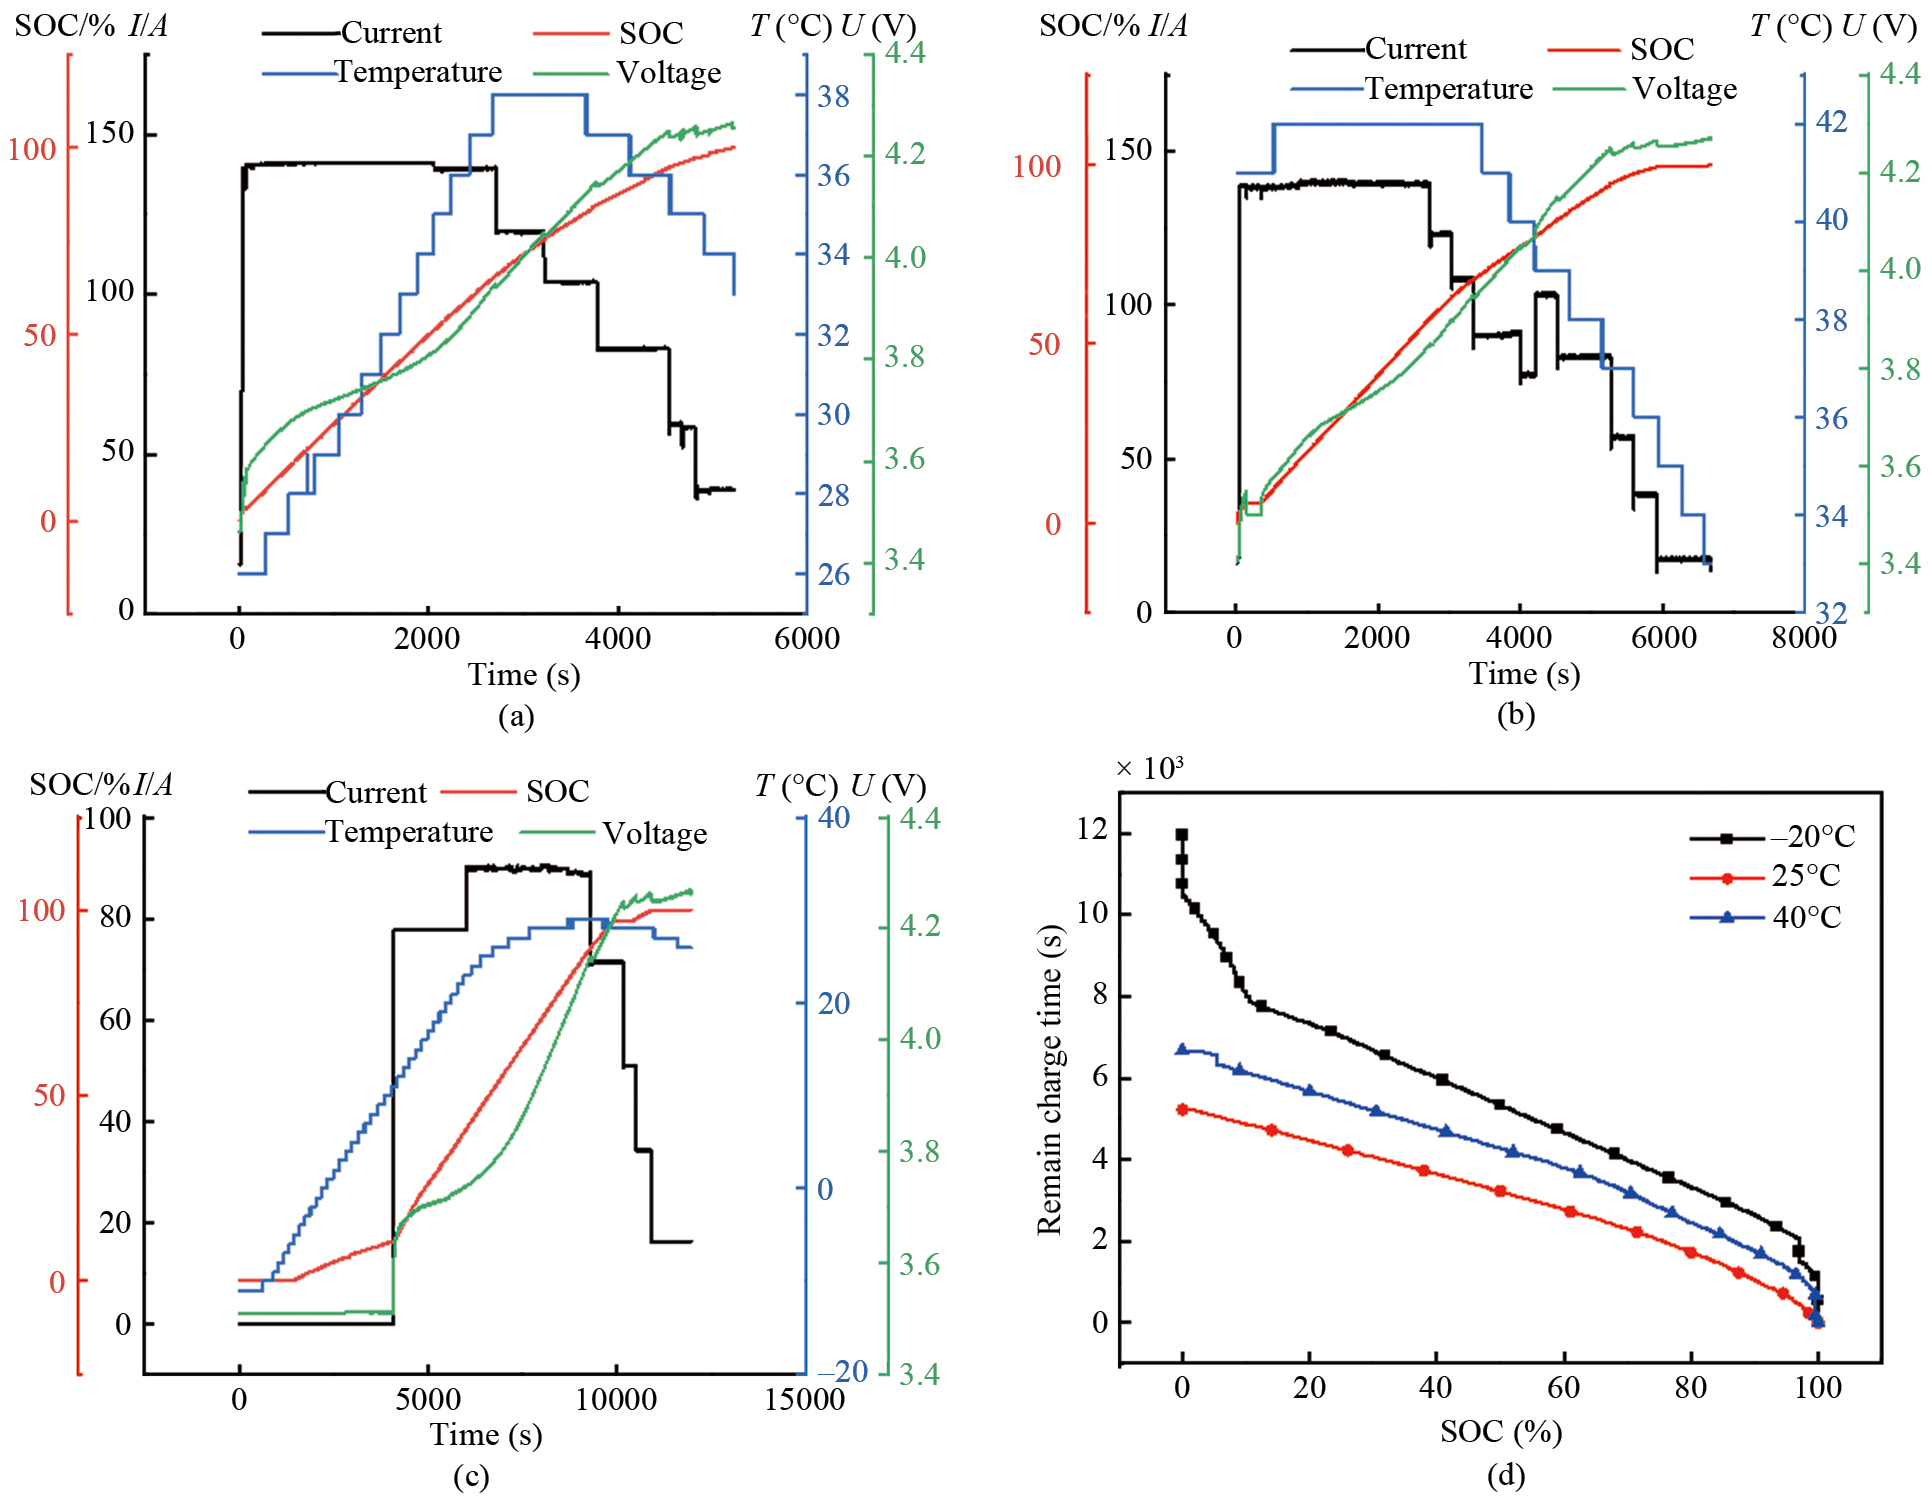
In the high-temperature environment, the initial charging current was approximately the same as that at room temperature. However, owing to its high external temperature, the battery itself had a high temperature. As shown in Fig. 2 (b), the internal temperature of the battery increased to a maximum temperature of 42 °C in a short time. With time, to reduce the battery temperature, the intelligent temperature control system of the power battery opened the refrigeration compressor, which caused the current to decrease twice in a short time. Subsequently, the internal temperature of the battery decreased. When the temperature was less than 40 °C, the refrigeration compressor was closed, and the current increased. In the subsequent charging process, the internal temperature of the battery decreased stepwise with the charging current. When the SOC = 95%, it was reduced to the minimum, and then the battery was charged to the completion of charging at the minimum current, which took 6821 s.
The test results showed that the ambient temperature, battery's internal temperature, and SOC were important factors restricting size and trend of the charging current for power batteries. When the SOC of the battery reached approximately 80%, the charging current decreased, and the charging time increased. The high internal temperature of a battery, causes safety hazards such as thermal runaway. Hence, the charging current also decreased at high temperatures, and the charging time increased. The charging time of lithium-ion batteries at different temperatures is shown in Fig. 2(d). From the figure, it can be seen that the variation in temperature affects the RCT of the battery. Therefore, RCT estimation methods should be developed for different charging temperature conditions [35].
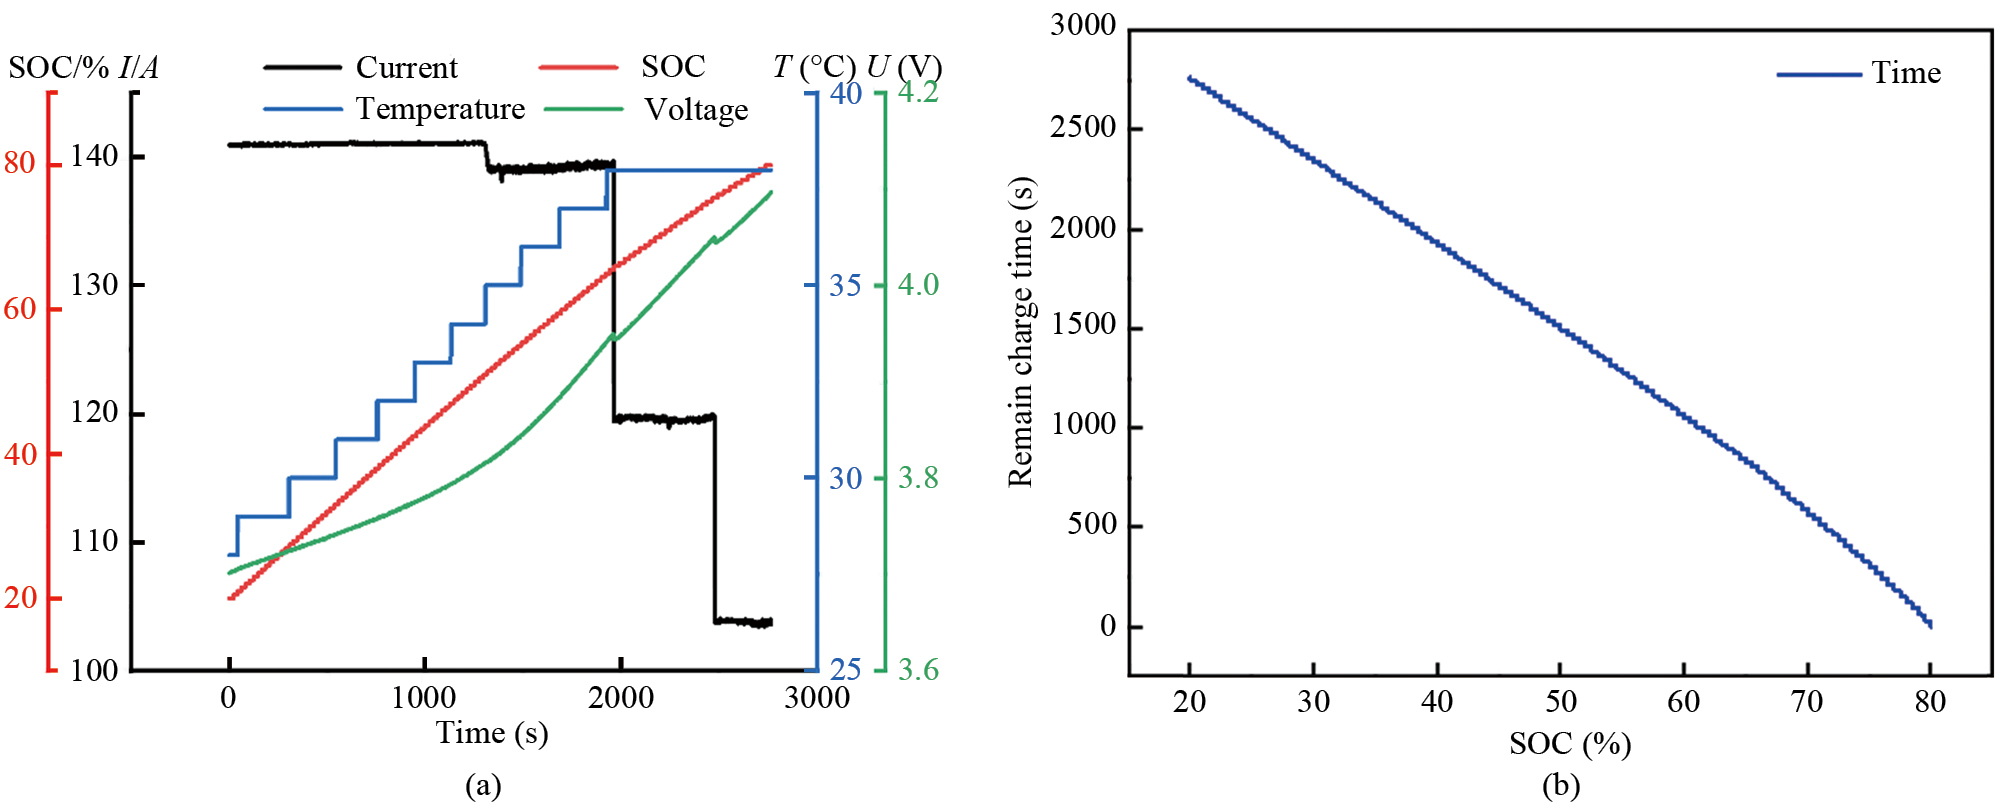
The cycle life of lithium-ion power batteries is a key indicator of their safe operation. For a long service life of the battery pack in the daily charge and discharge of the battery system, the optimal charge and discharge threshold is such that the SOC during discharge should not be less than 20%, the SOC during charging should not be more than 80%, and global charging under the slow charging strategy should be performed once a week. Figure 3 (a) depicts the charging curve of the optimal charging threshold at 25 °C. Figure 3(b) shows the charging efficiency of the battery was improved and the charging time is shortened by 20%–80%. It can be concluded that the charging performance of the battery will change owing to the difference between the charging start and the cut-off SOC of the battery system, which will also have a certain impact on the RCT.
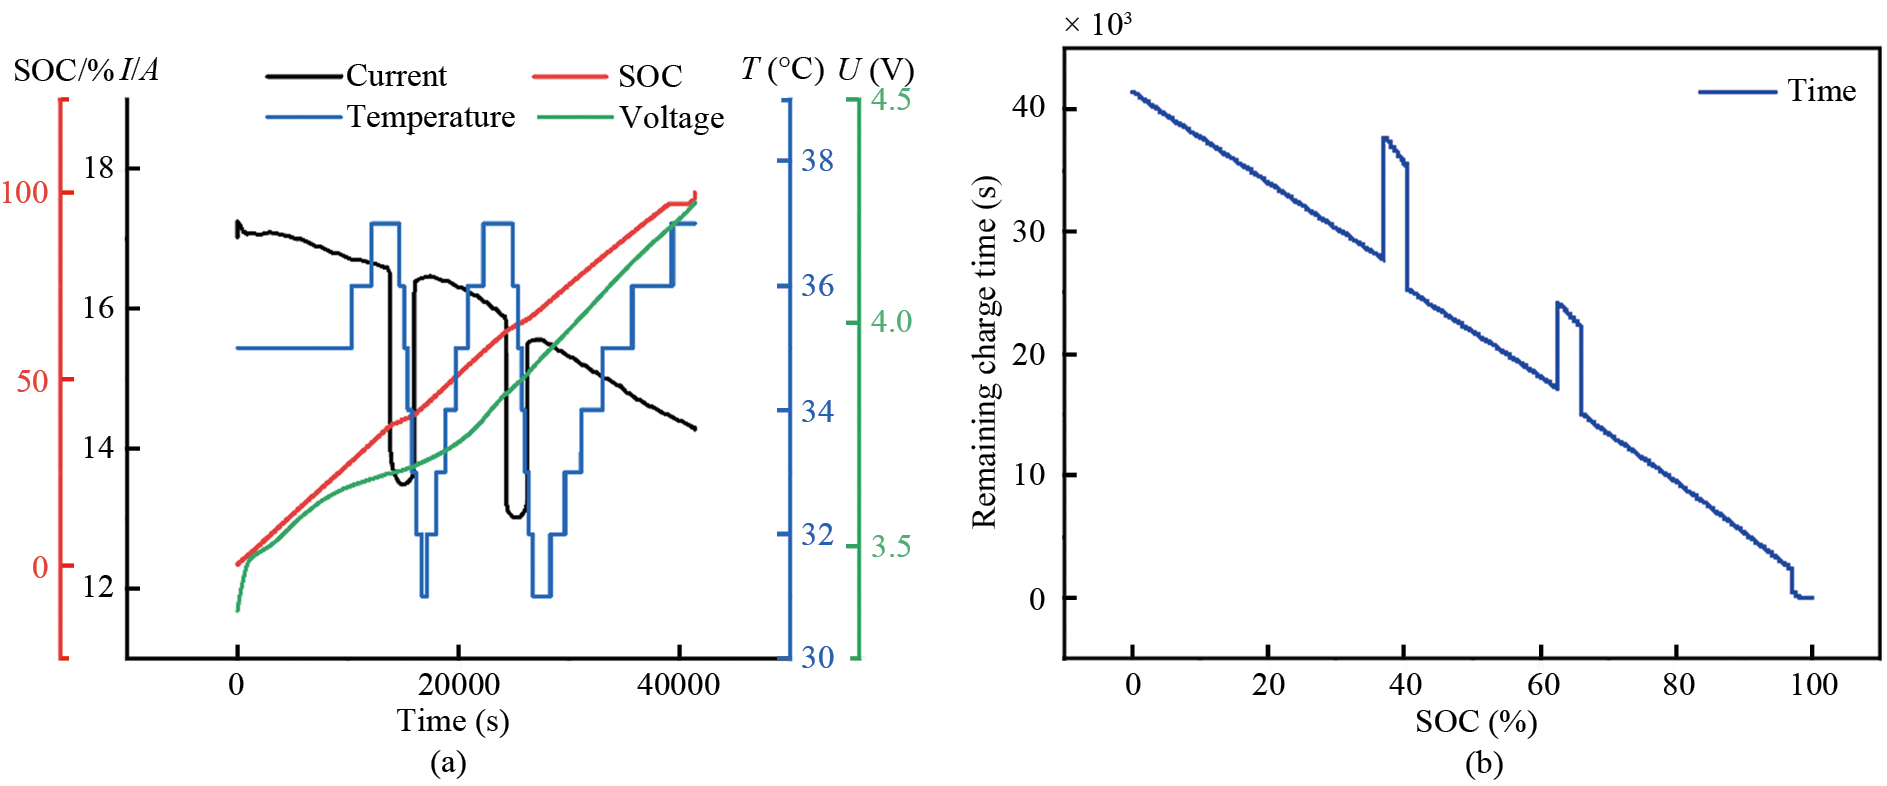
To ensure safe battery charging, the intelligent temperature control system of the power battery opens the refrigeration compressor during the charging process to reduce the internal temperature of the battery. Under the slow charging strategy, owing to the small charging current, the refrigeration compressor caused significant changes in the charging process. Compared with normal-temperature and low-temperature slow filling, high-temperature slow filling has a greater impact on RCT. The charging and RCT curves under the slow charging strategy at high temperatures are depicted in Fig. 4. Figure 4 (a) shows that the charging current fluctuation range of the battery system under the slow charging strategy is small, and the temperature of the battery cell increased and decreased periodically. The charging current had two current values that declined in the entire region, and both appeared when the internal temperature of the battery reached 37 °C. This occurred due to the rise in internal battery temperature during the charging process, prompting the refrigeration compressor to be turned on for cooling purposes within the battery. Thus, the charging current was input to the battery and compressor ends, resulting in a significant jump in the charging current at the battery end. As shown in Fig 4 (b), the RCT spiked, and the RCT increased. The above analysis shows that setting the charging threshold and the charging strategy significantly influenced the RCT of the battery system. Therefore, a method for accurately estimating the RCT under various charging strategies is required.
The TCN was developed using traditional convolutional neural network (CNN) model. The TCN uses extended causal convolution and residual models [36], which can capture the relationship between complex and nonlinear input data. This effectively prevents the loss of data and estimates local regeneration phenomena more stably. Moreover, the back propagation path of the TCN is independent of the direction of the time series, which overcomes the problem of gradient explosion or gradient disappearance in other time series models [37].
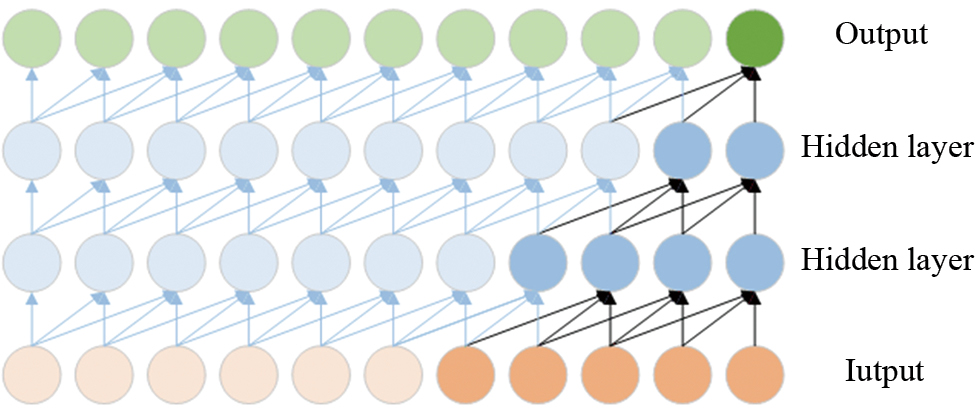
The TCN adopts a one-dimensional zero-filled fully convolutional network architecture, that can better adapt to the data source structure of the input parameters and ensure that any input length sequence of each hidden layer in the network can map it to the output sequence of the same length [38]. Meanwhile, the relationship between data from the past and the future should be ensured, and data leakage should be prevented data. Causal convolution was introduced into the TCN as proposed by WaveNet [39]. Causal convolution in the convolution operation, t time output y1, y2, .., yi, can only be obtained by convolution of input xi at time t and input data before time t[36]. The structure of the causal convolution block is illustrated in Fig. 5.
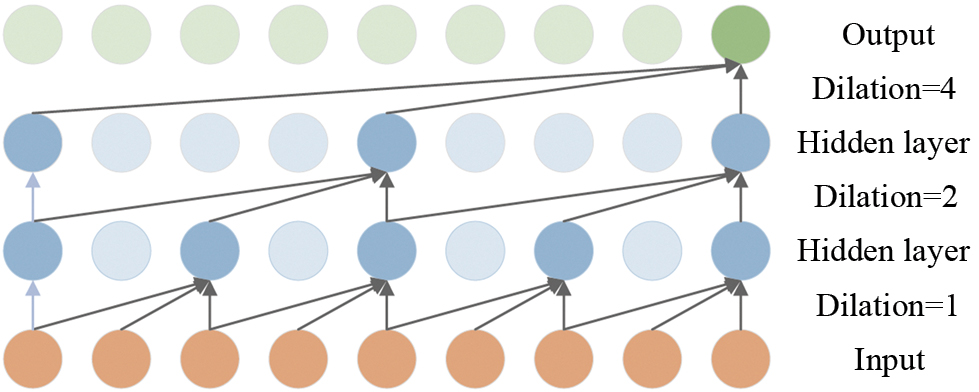
The receptive field of neurons in a neural network refers to a set of elements in the input data that affect the output value of the final layer. The volume of the elements determines the amount of information received by neuron receive. If only causal convolution is used to process long-time series data, the receptive field of the network model can only be increased by stacking causal convolution blocks or using larger convolution kernels. To address this problem, Yu et al. [40] proposed the use of dilated convolution to achieve an exponential expansion of the receptive field of the network architecture. Its structure is shown in Fig. 6.
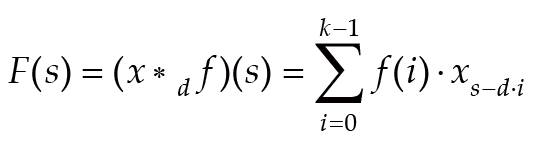
Specifically, for a one-dimensional input sequence x and a convolution kernel f, where x ∈ Rn, f : { 0,..., k-1 } → R, the dilation convolution operation F on the element s of the sequence is expressed as follows:(1)where d is the expansion convolution coefficient, k is the size of the convolution kernel, * is the convolution operation, and xs-d · i is the element position of the past input vector. When d = 1, dilated causal convolutions is transformed into ordinary causal convolutions, and when d > 1, dilated causal convolutions can effectively expand the receptive field of the model such that the neurons in the network can extract more effective data information [41].
The size of the receptive field in the TCN model is determined by both the network structure and the model parameters. During the training process, the network depth is frequently increased by superimposing the number of network layers to obtain a larger receptive field. However, simply increasing the number of network layers increases the complexity of the model, resulting in problems such as gradient dispersion or gradient explosion. To overcome these above problems, we introduce a residual block structure into the TCN model to construct a deep network [42]. Therefore, the TCN model typically uses a residual block instead of a general convolution layer to calculate the convolution of the network layer.
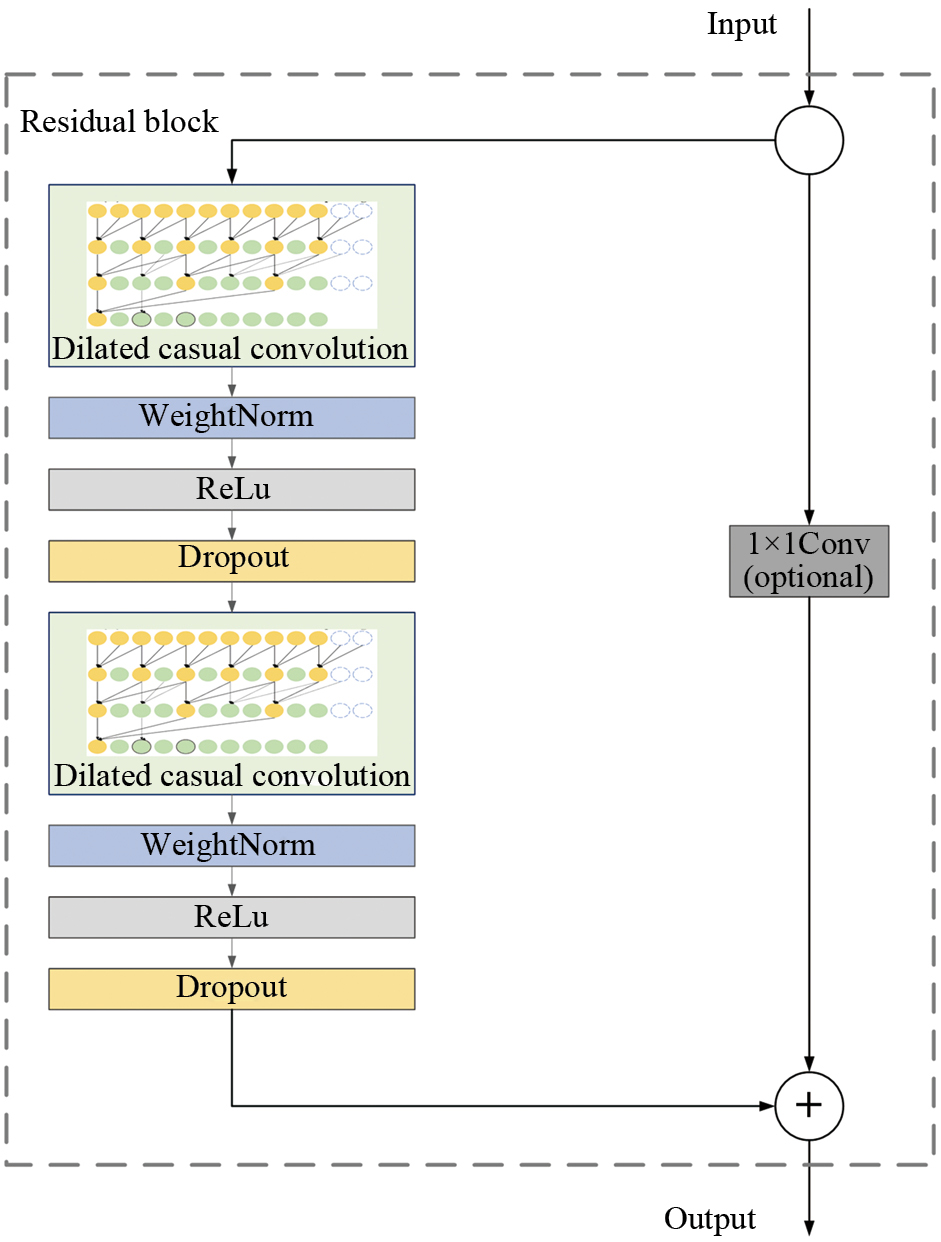
The residual block of the TCN is shown in Fig. 7. The entire residual structure contains two blocks, connected by residual lines. Each residual block contains two layers of dilated causal convolution, weight normalization, rectifier linear unit (ReLU) activation function [37], and dropout [43]. The residual block output is calculated by directly adding the input of a residual block to its output, as shown in Eq. (2).(2)where x is the input value, and F(x) is the output after a series of linear changes and activations. In the proposed TCN model, the input and output variables have different dimensions. To solve the problem of the dimension between the input and output, the model uses a 1×1 convolution to ensure that the input and output have the same dimensions.
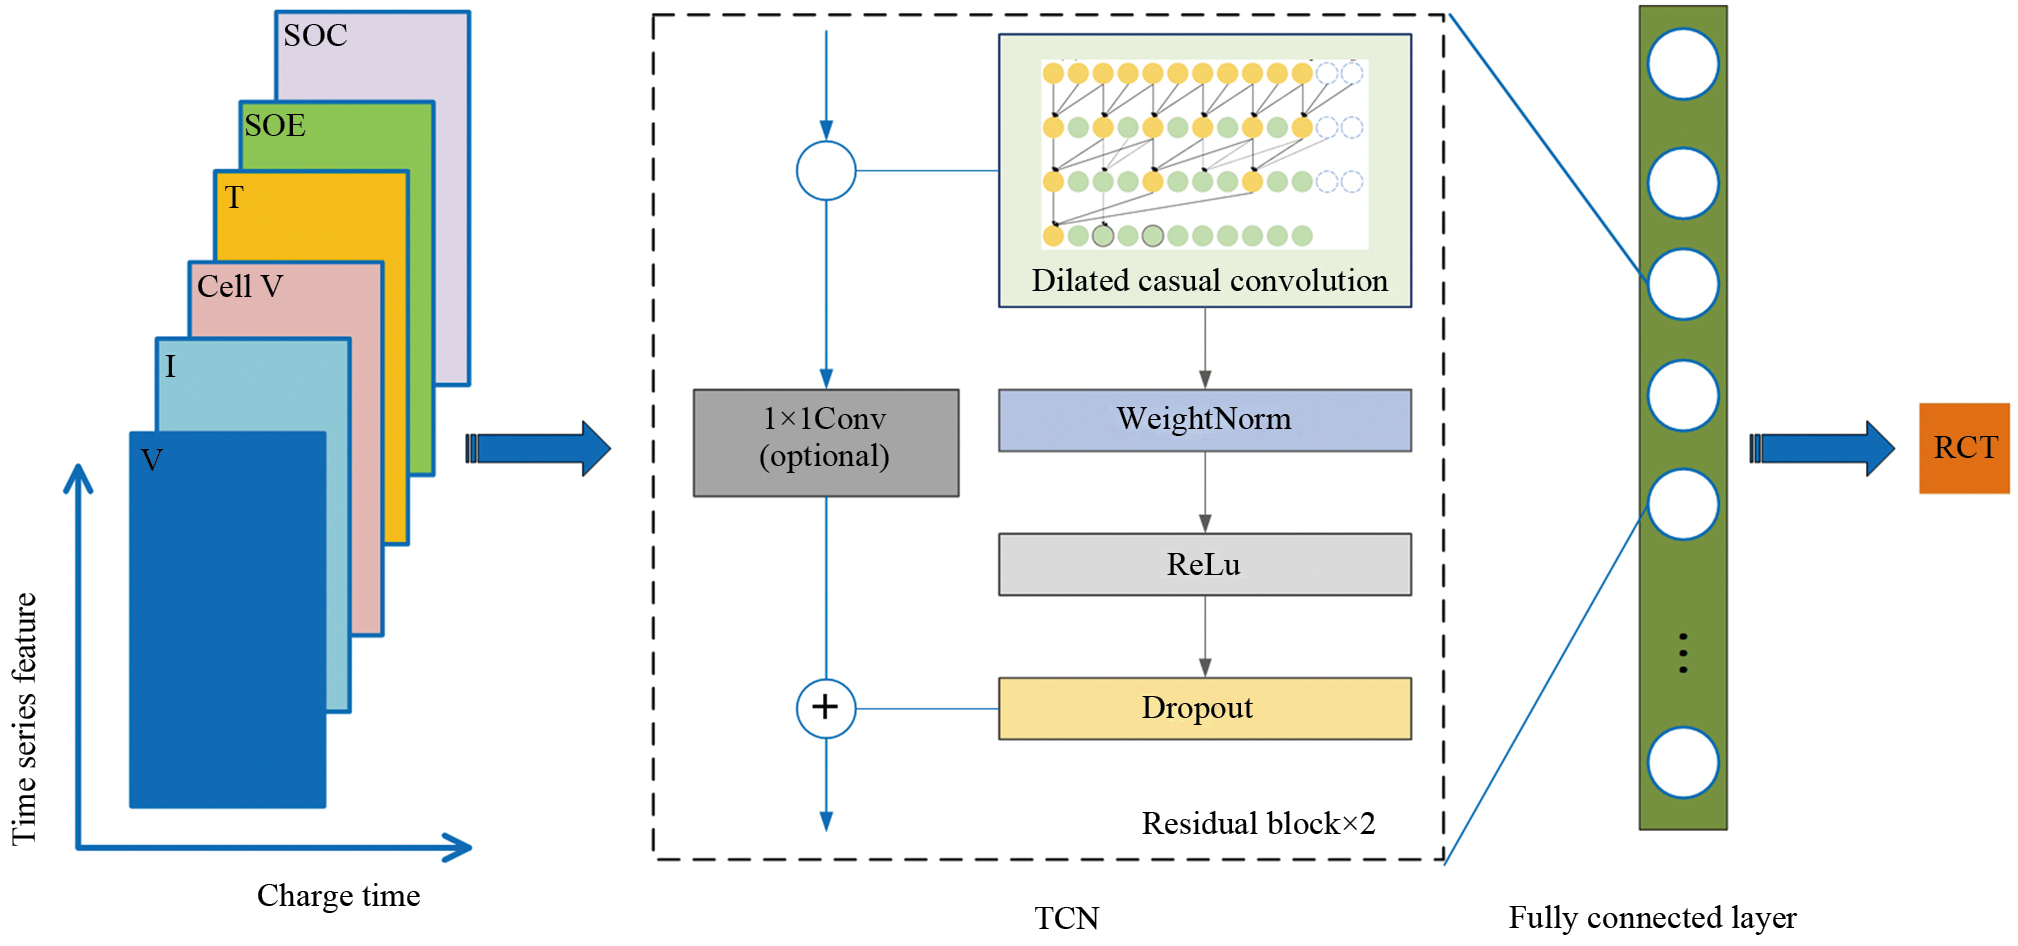
The structure of the TCN model is shown in Fig. 8. The TCN model starts from the sequence input layer, where the input sequence includes parameters such as total voltage, current, temperature, cell voltage, SOC, and SOE. The TCN layer contains two stacks, each of which has three constitutional layers: the size of the convolution kernel is 3×3; and the filters are 64. In the dilated convolution, the data information in the input sequence is learned using expansion methods the 1, 2, and 4. Simultaneously, the conventional convolution layer is replaced with 1D convolution in the residual block. Finally, the RCT is estimated using a fully connected layer.
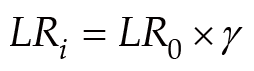
The learning rate is a crucial parameter that has a significant impact on the performance of neural network models. In traditional neural network models, SLR is often used to train neural networks. In the training process, if the learning rate of neural network model is set too low, the local optimization ability of the model is strong. However, this may cause an increase in the number of iterations of the model and a slow convergence speed. An excessively high learning rate makes it difficult for to converge. To solve this problem, many researchers have proposed the use of DLR for neural network training. Currently, methods for dynamically adjusting the learning rate include adaptive learning rates [44] and cyclic learning rates [45]. However, the aforementioned methods must be continuously tested to determine the range to achieve an adaptive model learning rate. Because neural network training has different requirements for learning rates in different processes, we use a fixed-step decay DLR to improve the TCN model. The learning rate undergoes a decay of 50% after every 50 epochs. The updated formula for the DLR is shown in Eq. (3).(3)where LRi is the learning rate of the i-th epoch, LR0 is the initial learning rate, γ is the attenuation factor, and the size is 0.65.
However, owing to the DLR mechanism in the network, the learning rate of the TCN model differs significantly in the early and late training stages. A large learning rate was set at the beginning of the model training to accelerate learning. As the step size increases, the learning rate gradually decreases. The model enters a later stage of training, and the weight value is within the optimal solution range. If the learning rate continues to be updated at this time, it causes the loss function (loss) to oscillate and the model to overfit. Therefore, an ES is introduced into the TCN model, which is combined with the DLR. When the accuracy of continuous n epochs does not change, the accuracy does not improve, and the weight after the learning rate is no longer updated is considered the final parameter of the neural network. The algorithm flow is shown in Fig. 9.
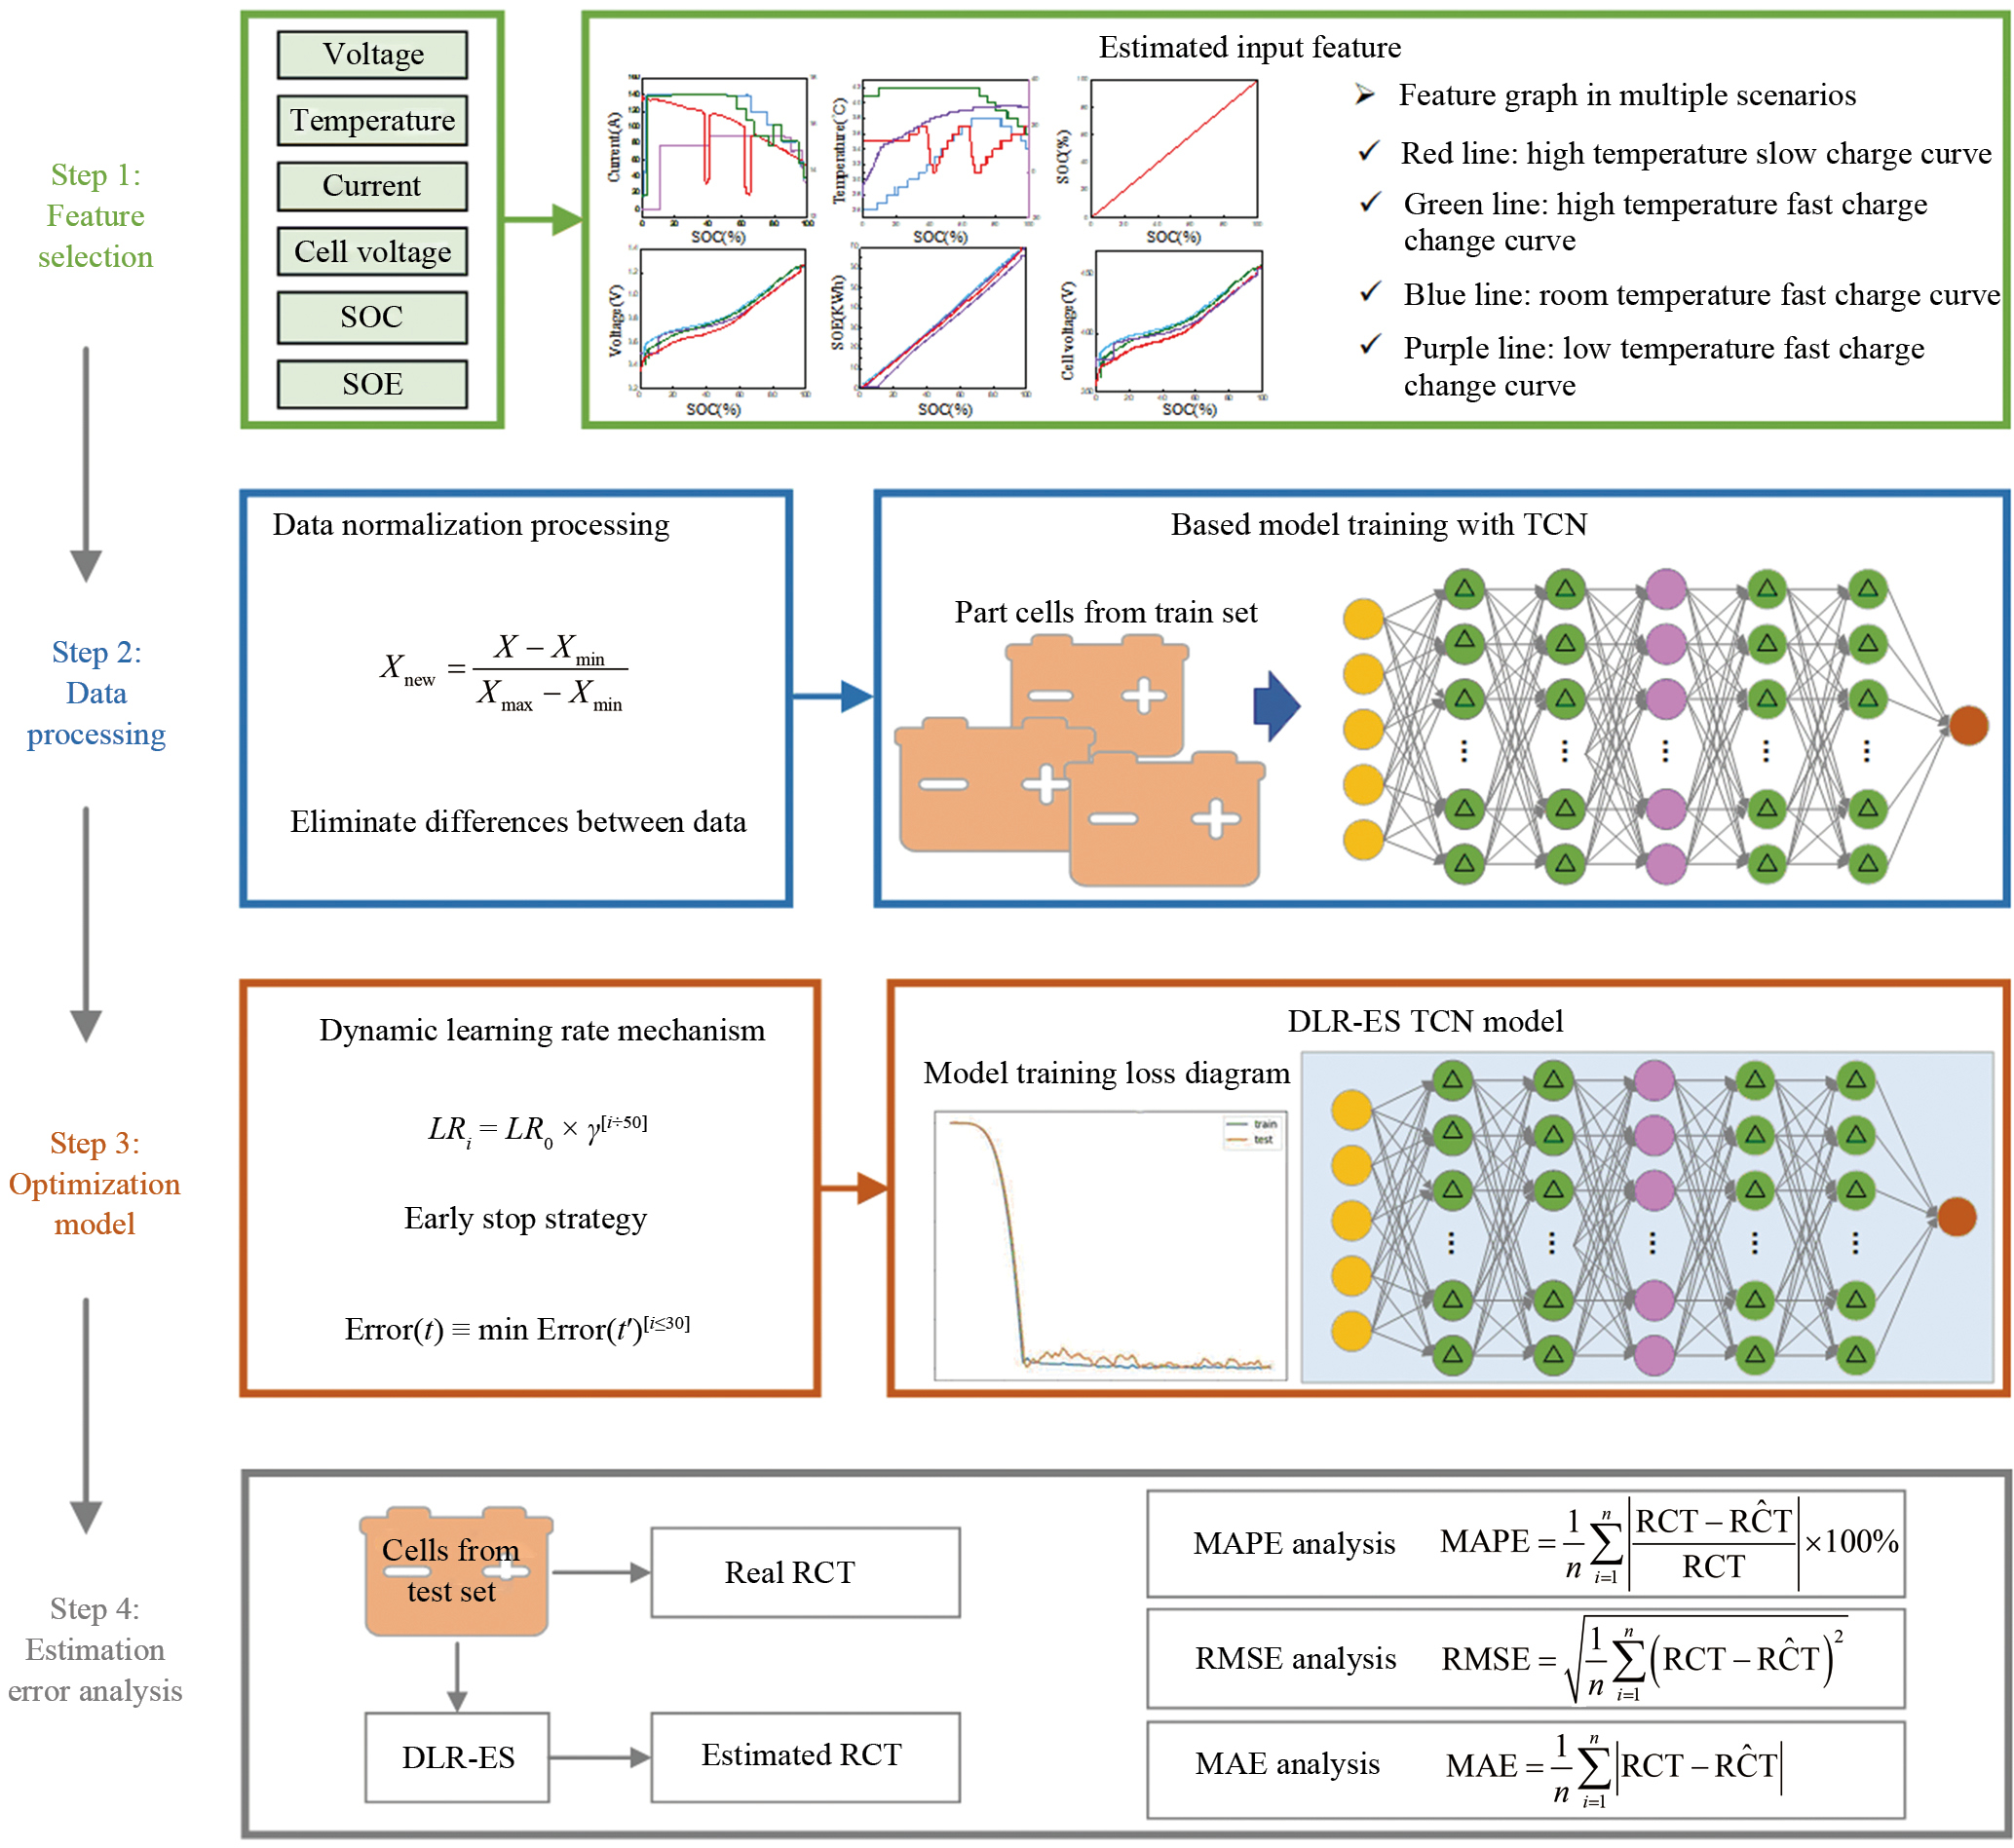
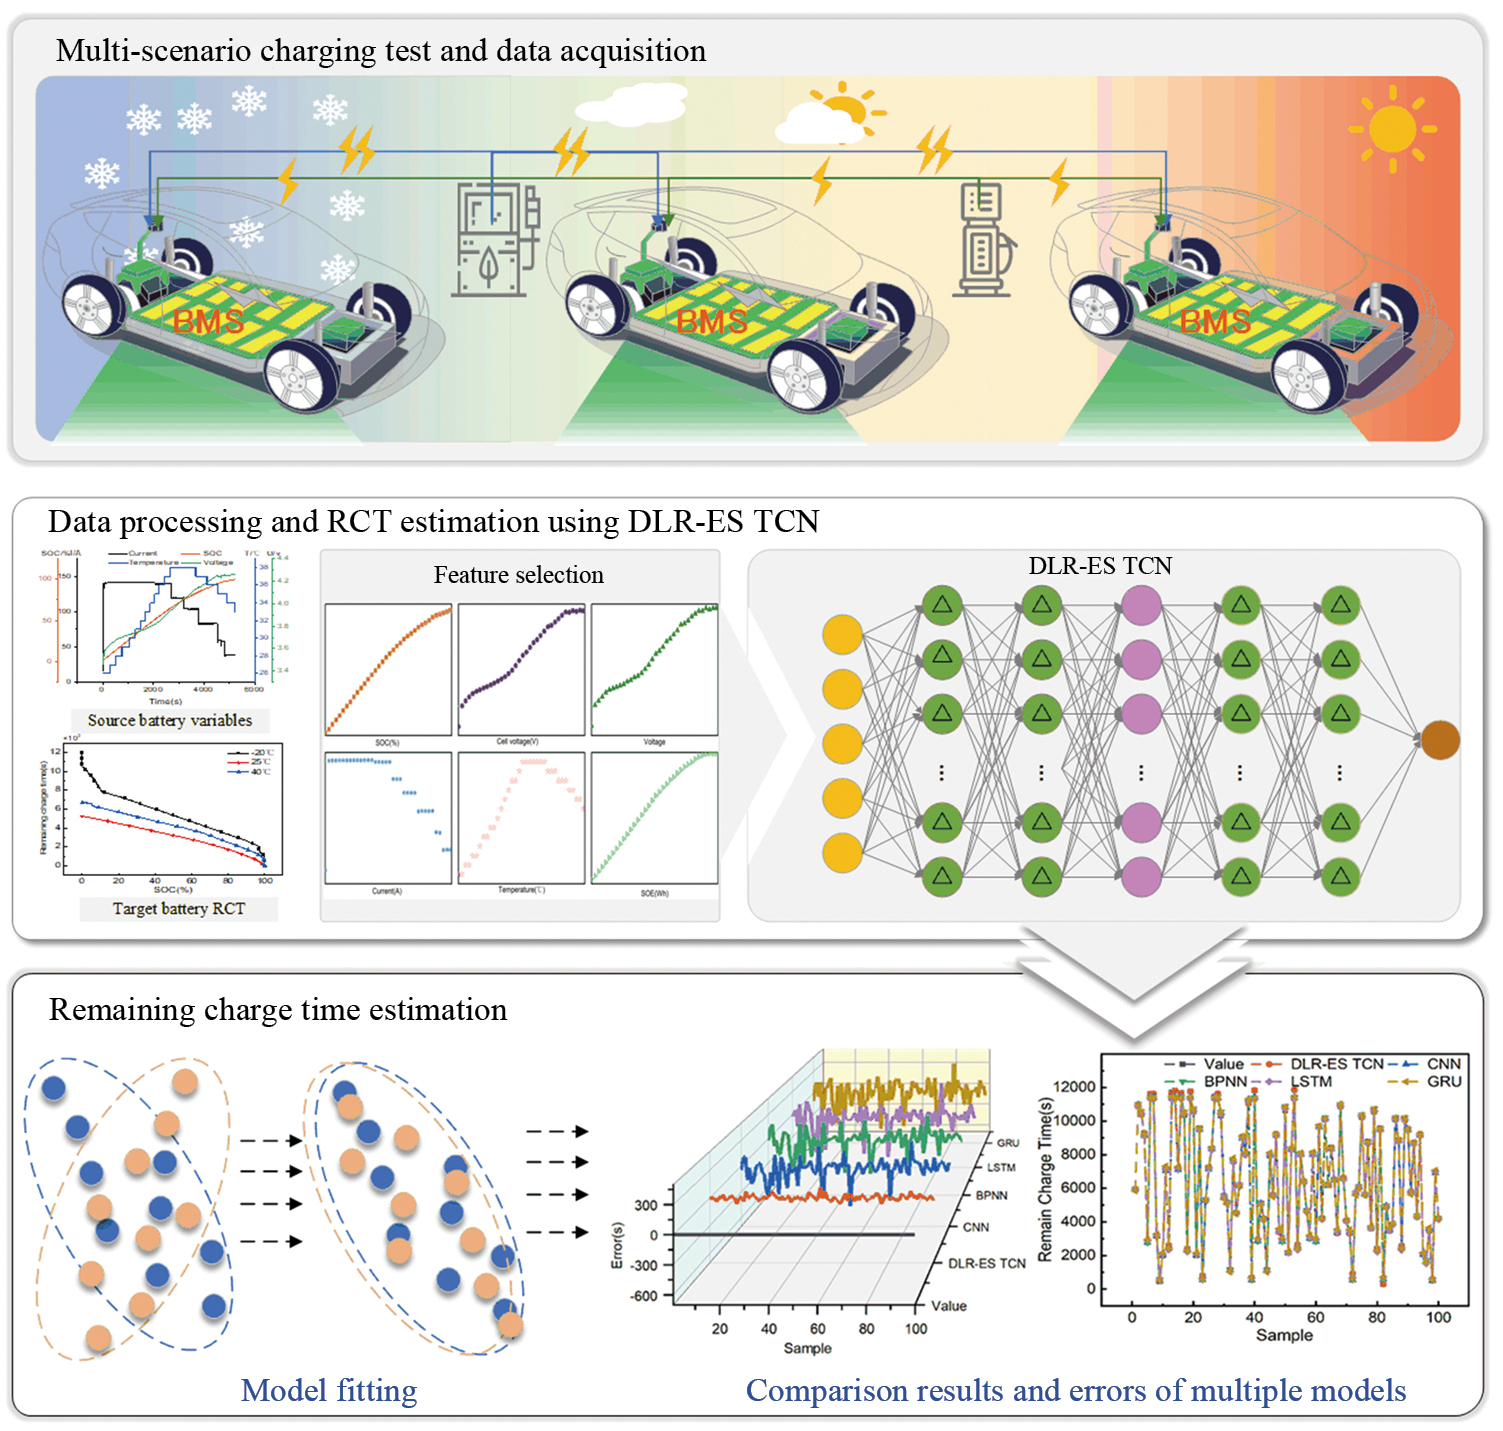
The proposed RCT estimation framework for multi-scenario charging data based on deep learning is shown in Fig. 10. First, the external parameters of the battery system recorded during the battery pack charging experiment were extracted. The data were then processed. Finally, the proposed time convolution network is used to estimate the RCT of lithium-ion batteries.
In this section, the estimation performances of TCN models based on SLR and DLR are compared. To better compare the influence of the two learning rate mechanisms on the estimation accuracy of the TCN model, we used the estimation errors of the charging test data at –20, 25, and 40 °C as the basis for model evaluation. The best estimation results for the two models are shown in Table 3. The error of the DLR-ES TCN model is smaller than that of the traditional TCN model, which proves that the model has higher stability and generalization ability. Therefore, the DLR-ES TCN model was used in subsequent experiments.
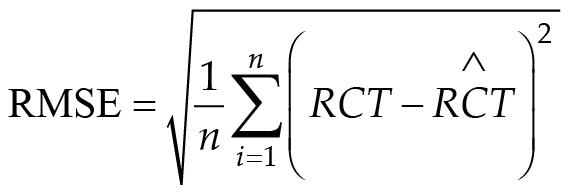
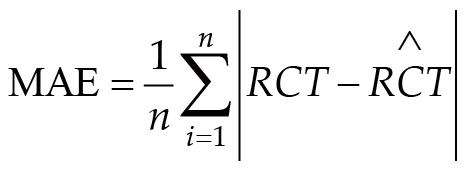
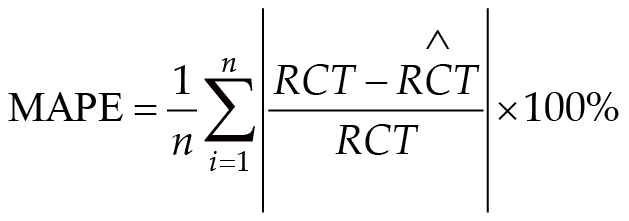
In this study, three metrics were used to evaluate the stability and accuracy of the RCT battery estimates.
The root mean square error (RMSE) was used to measure the dispersion and convergence performance of the deviation between the actual value of the RCT and the estimated value.
The mean absolute error (MAE) measures the difference between the estimated and the actual values.
The mean absolute percentage (MAPE) error was used to describe the accuracy of the estimated model, reflecting the stability of the model.(4)(5)(6)
To verify the effectiveness of the proposed framework. We compared traditional CNN, gated recurrent units (GRU), long short-term memory networks (LSTM), and back propagation neural networks (BPNN) with the proposed DLR-ES TCN model. To ensure the credibility of the results, we set the learning rate decay for all algorithms in this study to avoid any potential randomness. Each neural network was trained and tested individually, and the optimal model was obtained after training and parameter adjustment several times. The model inputs consist of Xk =[Vtol(k), Vsig(k), I(k), T(k), SOC(k), SOE(k)], where Vtol(k), Vsig(k), I(k), T(k), SOC(k), and SOE(k) represent the voltage, cell voltage, current, temperature, SOC, and SOE at time step k. The target data for the model is RCT (k) at the same time step. To ensure a fair comparison of model estimation performance, we randomly selected 20% of the data for testing during the experiment, while using the remaining 80% for model training. The optimizer for the model is selected as Adam. The loss function employed is mean square error (MSE), and the number of epochs is set to 500.
The experimental hardware platform for running the model is based on an Intel (R) CoreTM i7-10875H CPU @ 2.30 GHz (eight cores, 16 threads) and NVIDIA GeForce RTX 2060; operating system: Windows 10 (64-bit); memory: 16GB.
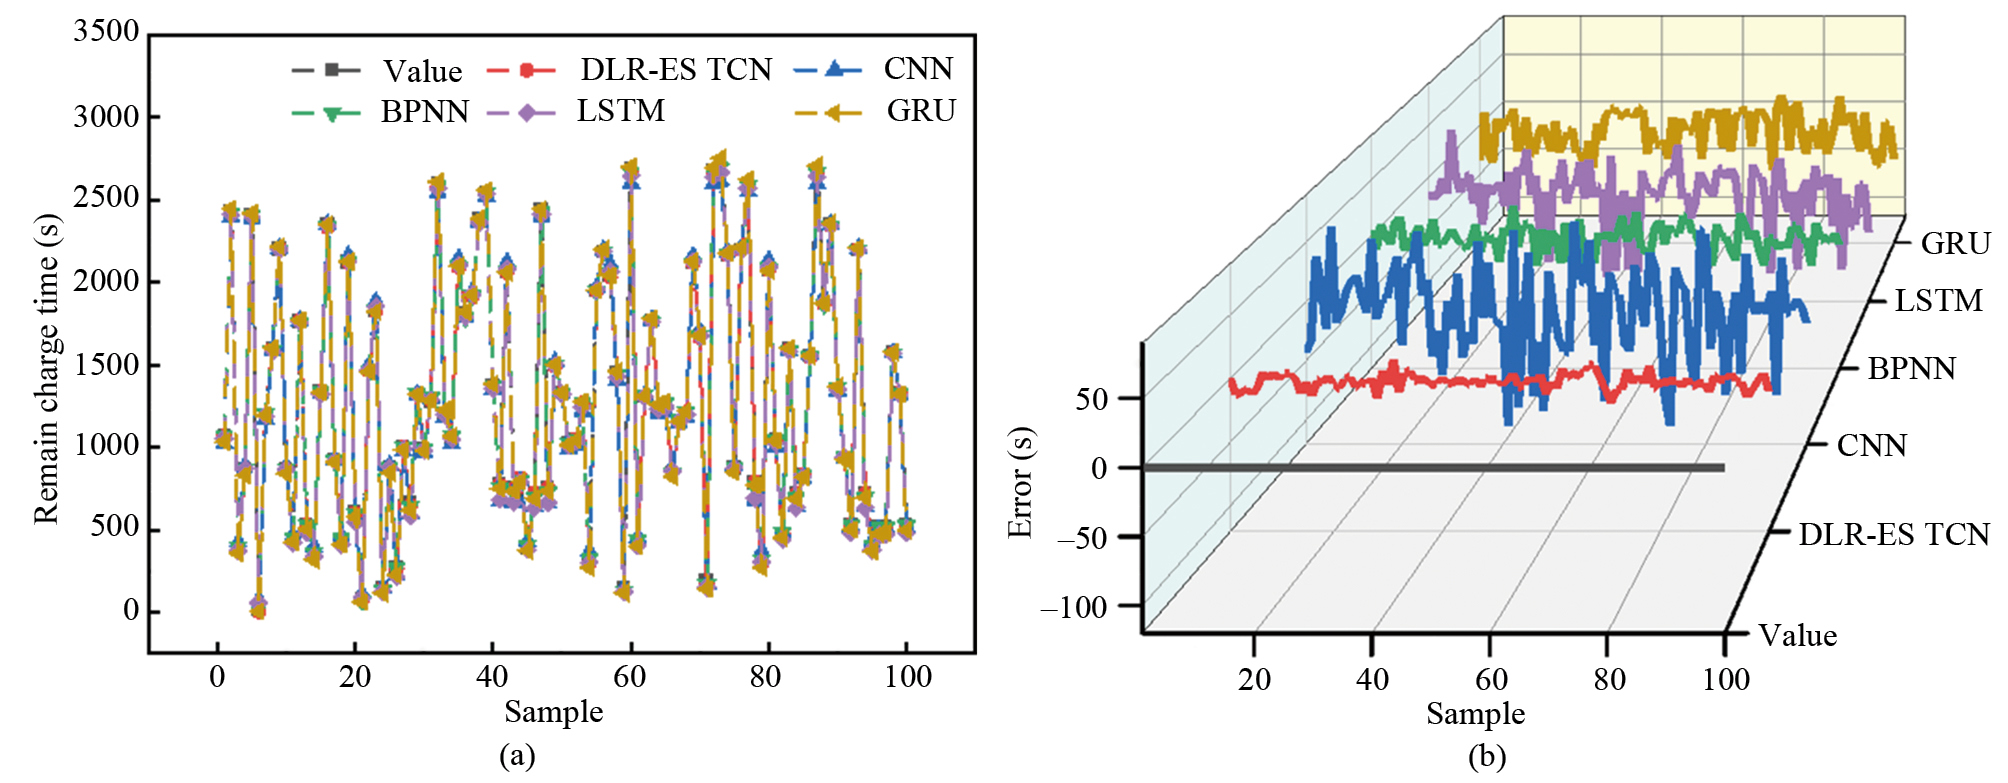
As the large sample size of the test set, observing the fitting effect between the estimated and the actual values was difficult. Therefore, when drawing the result map, the estimated values of 100 samples were randomly selected from the test sample for drawing to better observe the fitting effect of the model. Figure 11 shows the RCT estimation results and errors for different models at –20, 25, and 40 °C. From the comparison of the estimated RCT and the actual values, the overall trend between the estimated and the actual values of the model was roughly the same, but the DLR-ES TCN model had a higher consistency than the other models at the inflection point. In the estimation results at 40 °C, other models lacked stability and had significant lag. From the estimation results and error diagram for –20 °C, we observe that the time span of model estimation error increased. In the low-temperature environment, the maximum error of the RCT estimation value of the traditional CNN model was 416 s, the BPNN model was 428 s, that of the LSTM model was 501 s, that of the GRU model is 298 s, and that of the DLR-ES TCN model was 112 s, indicating good robustness. Under environmental changes, the DLR-ES TCN model exhibited strong stability and robustness, whereas other models lagged.
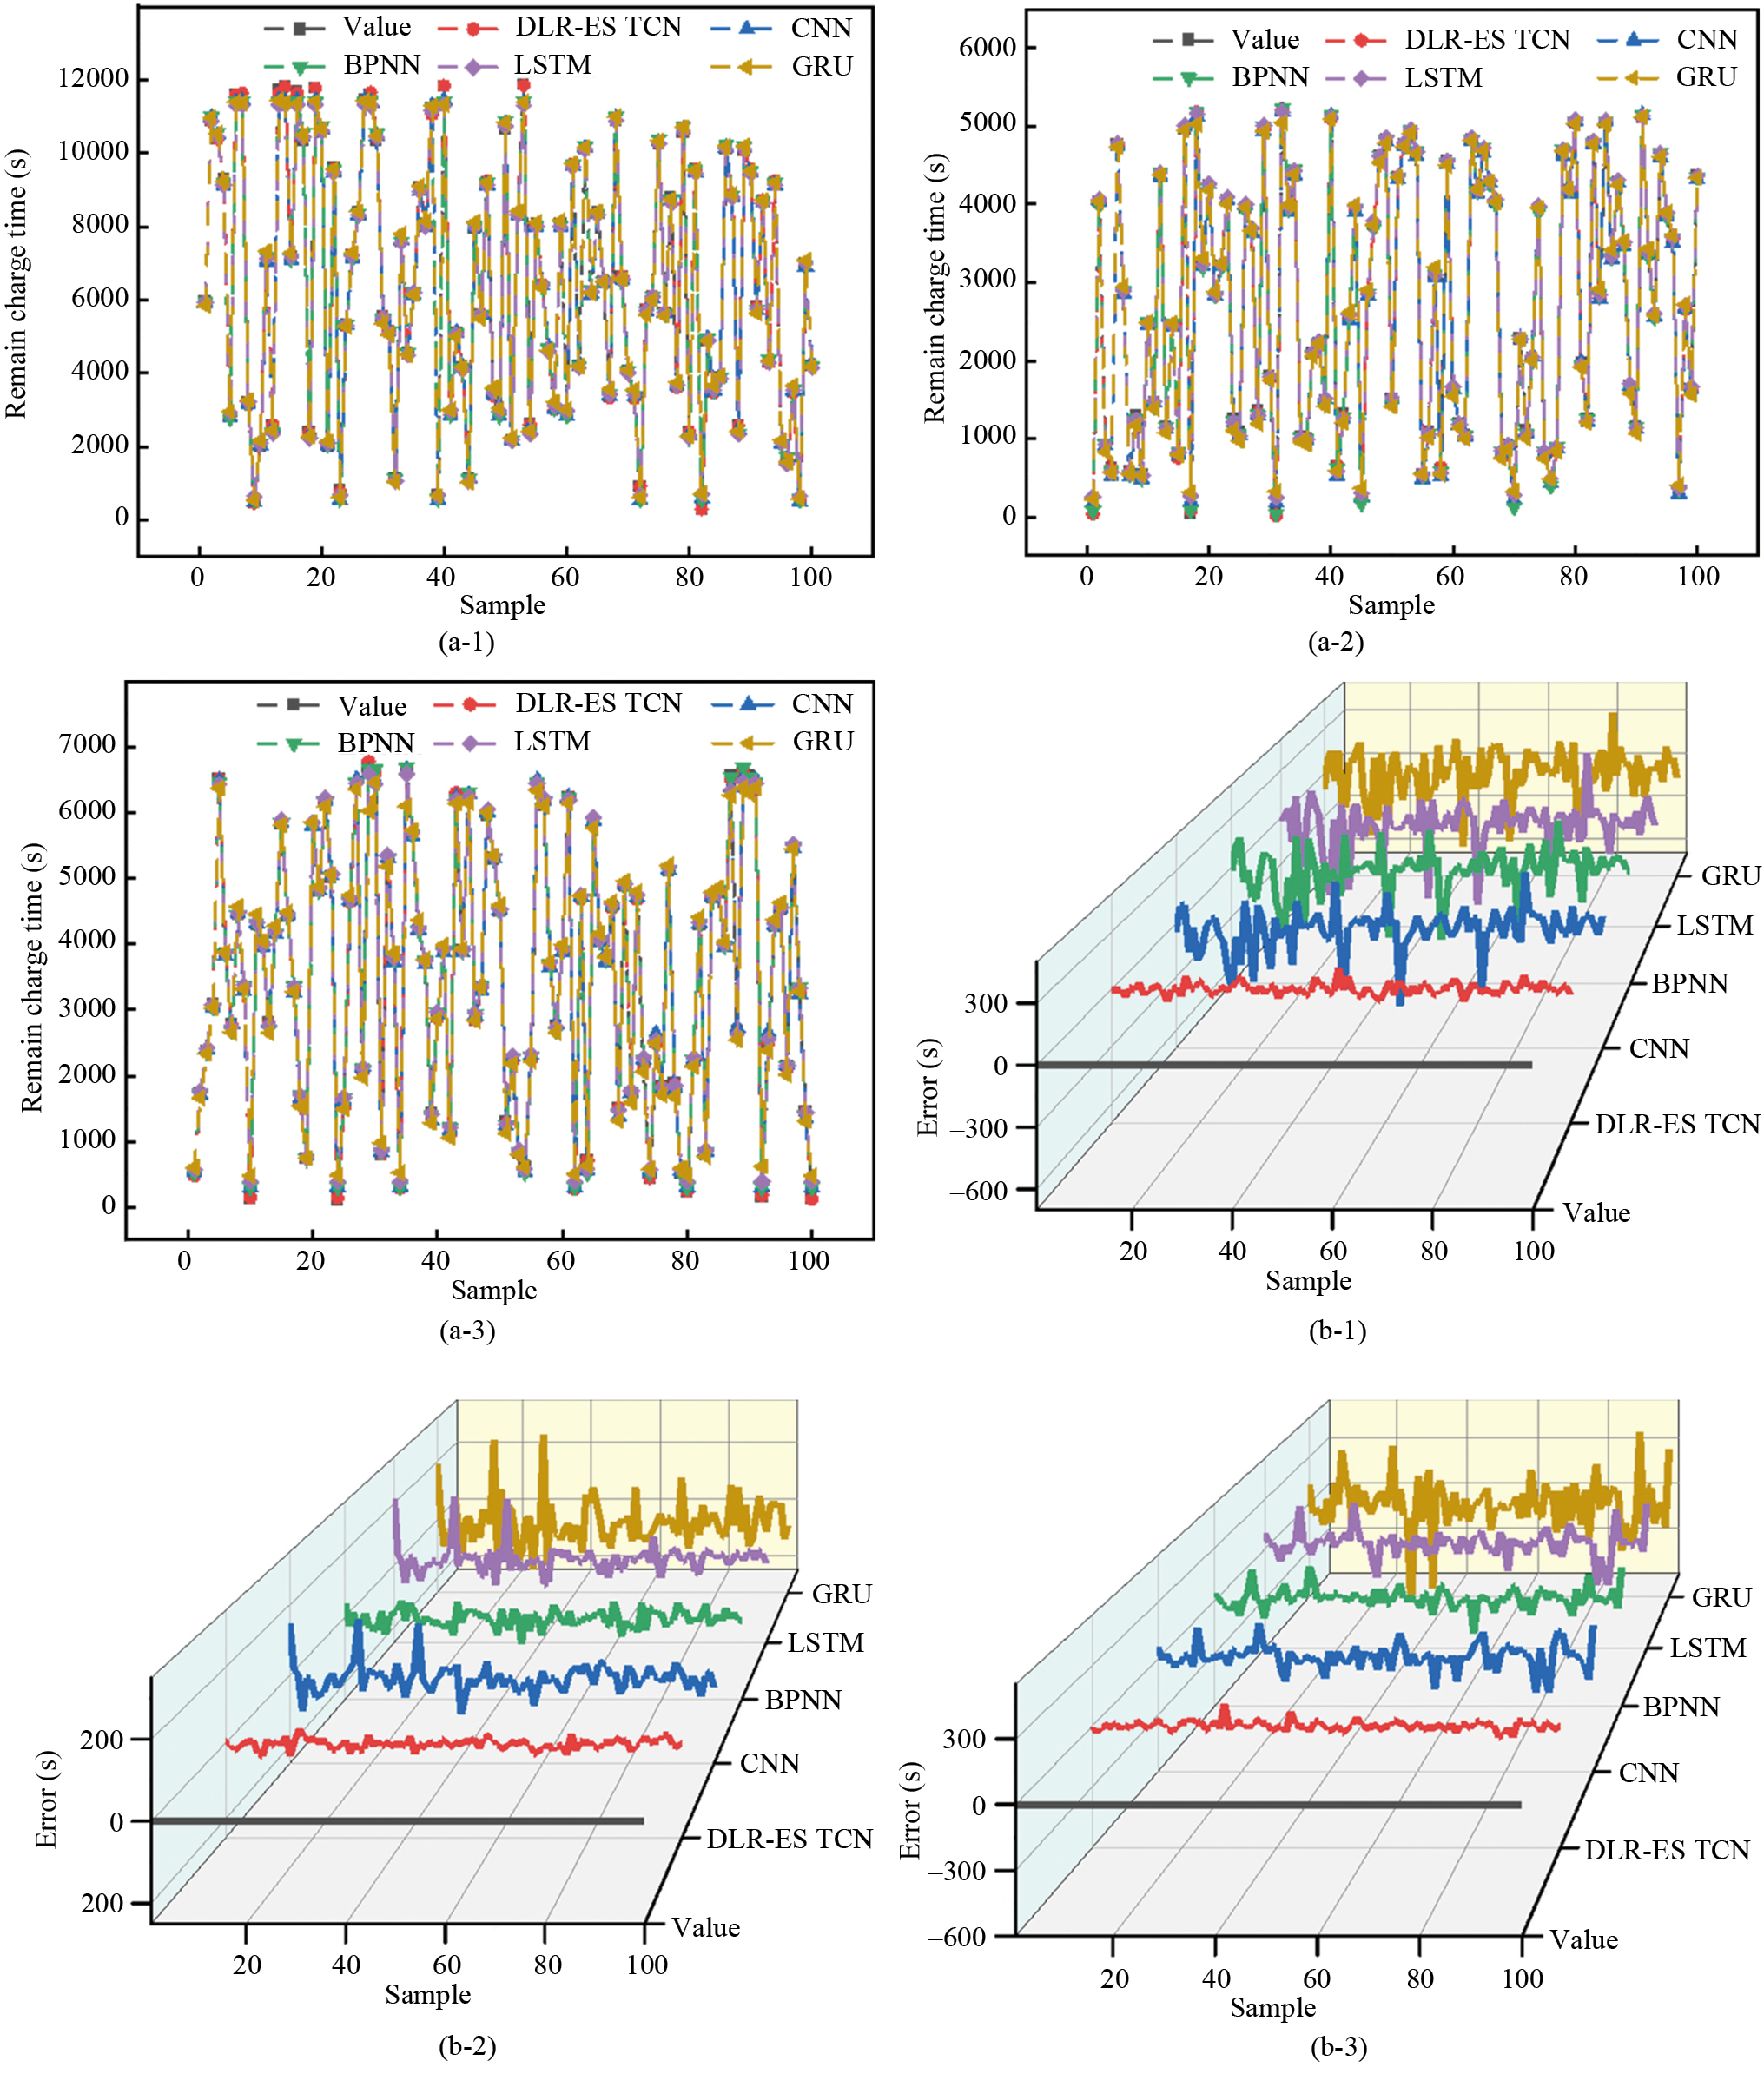
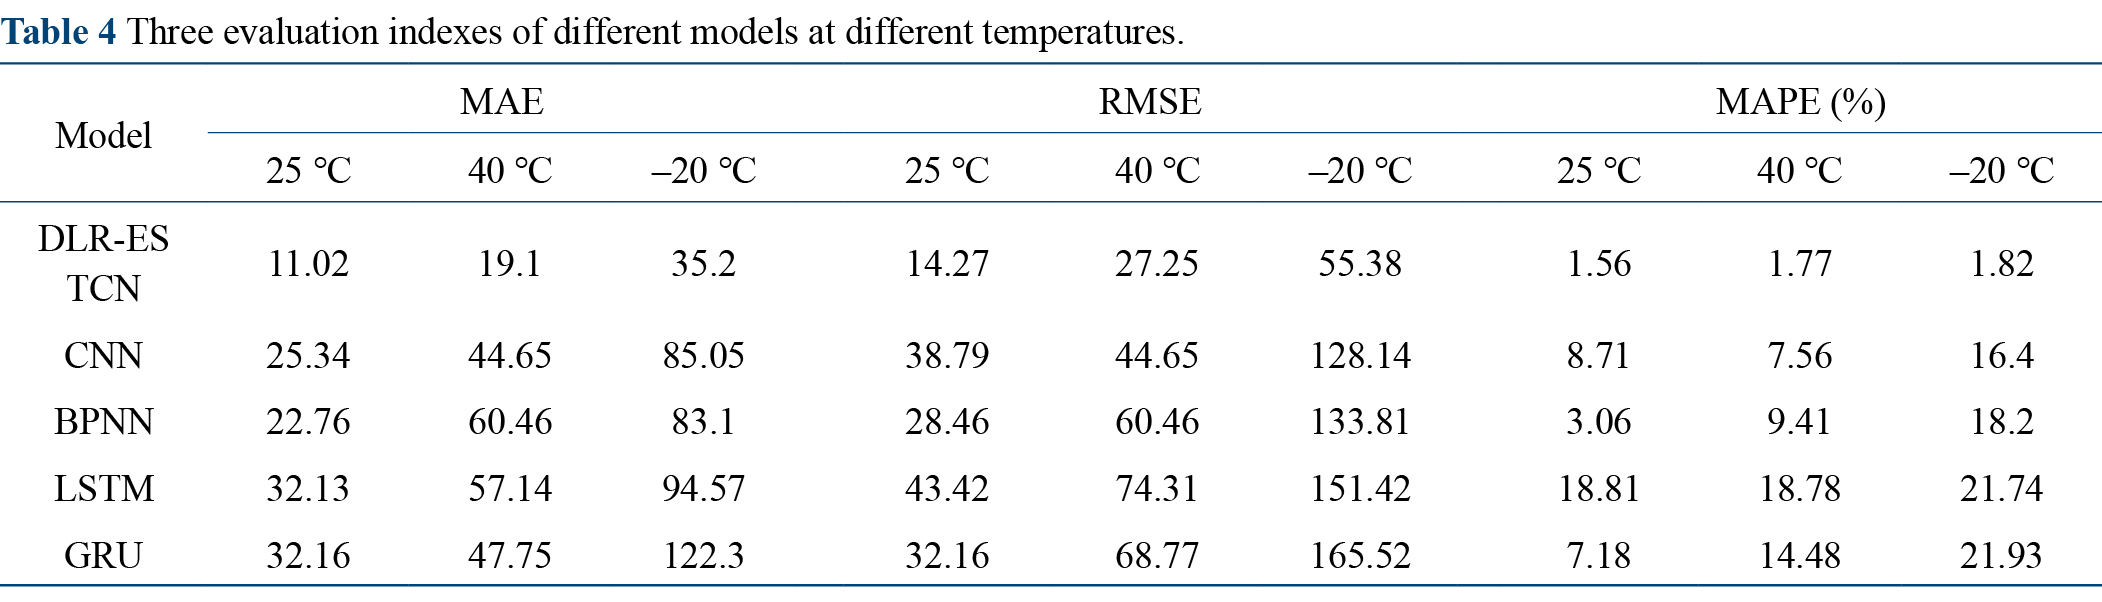
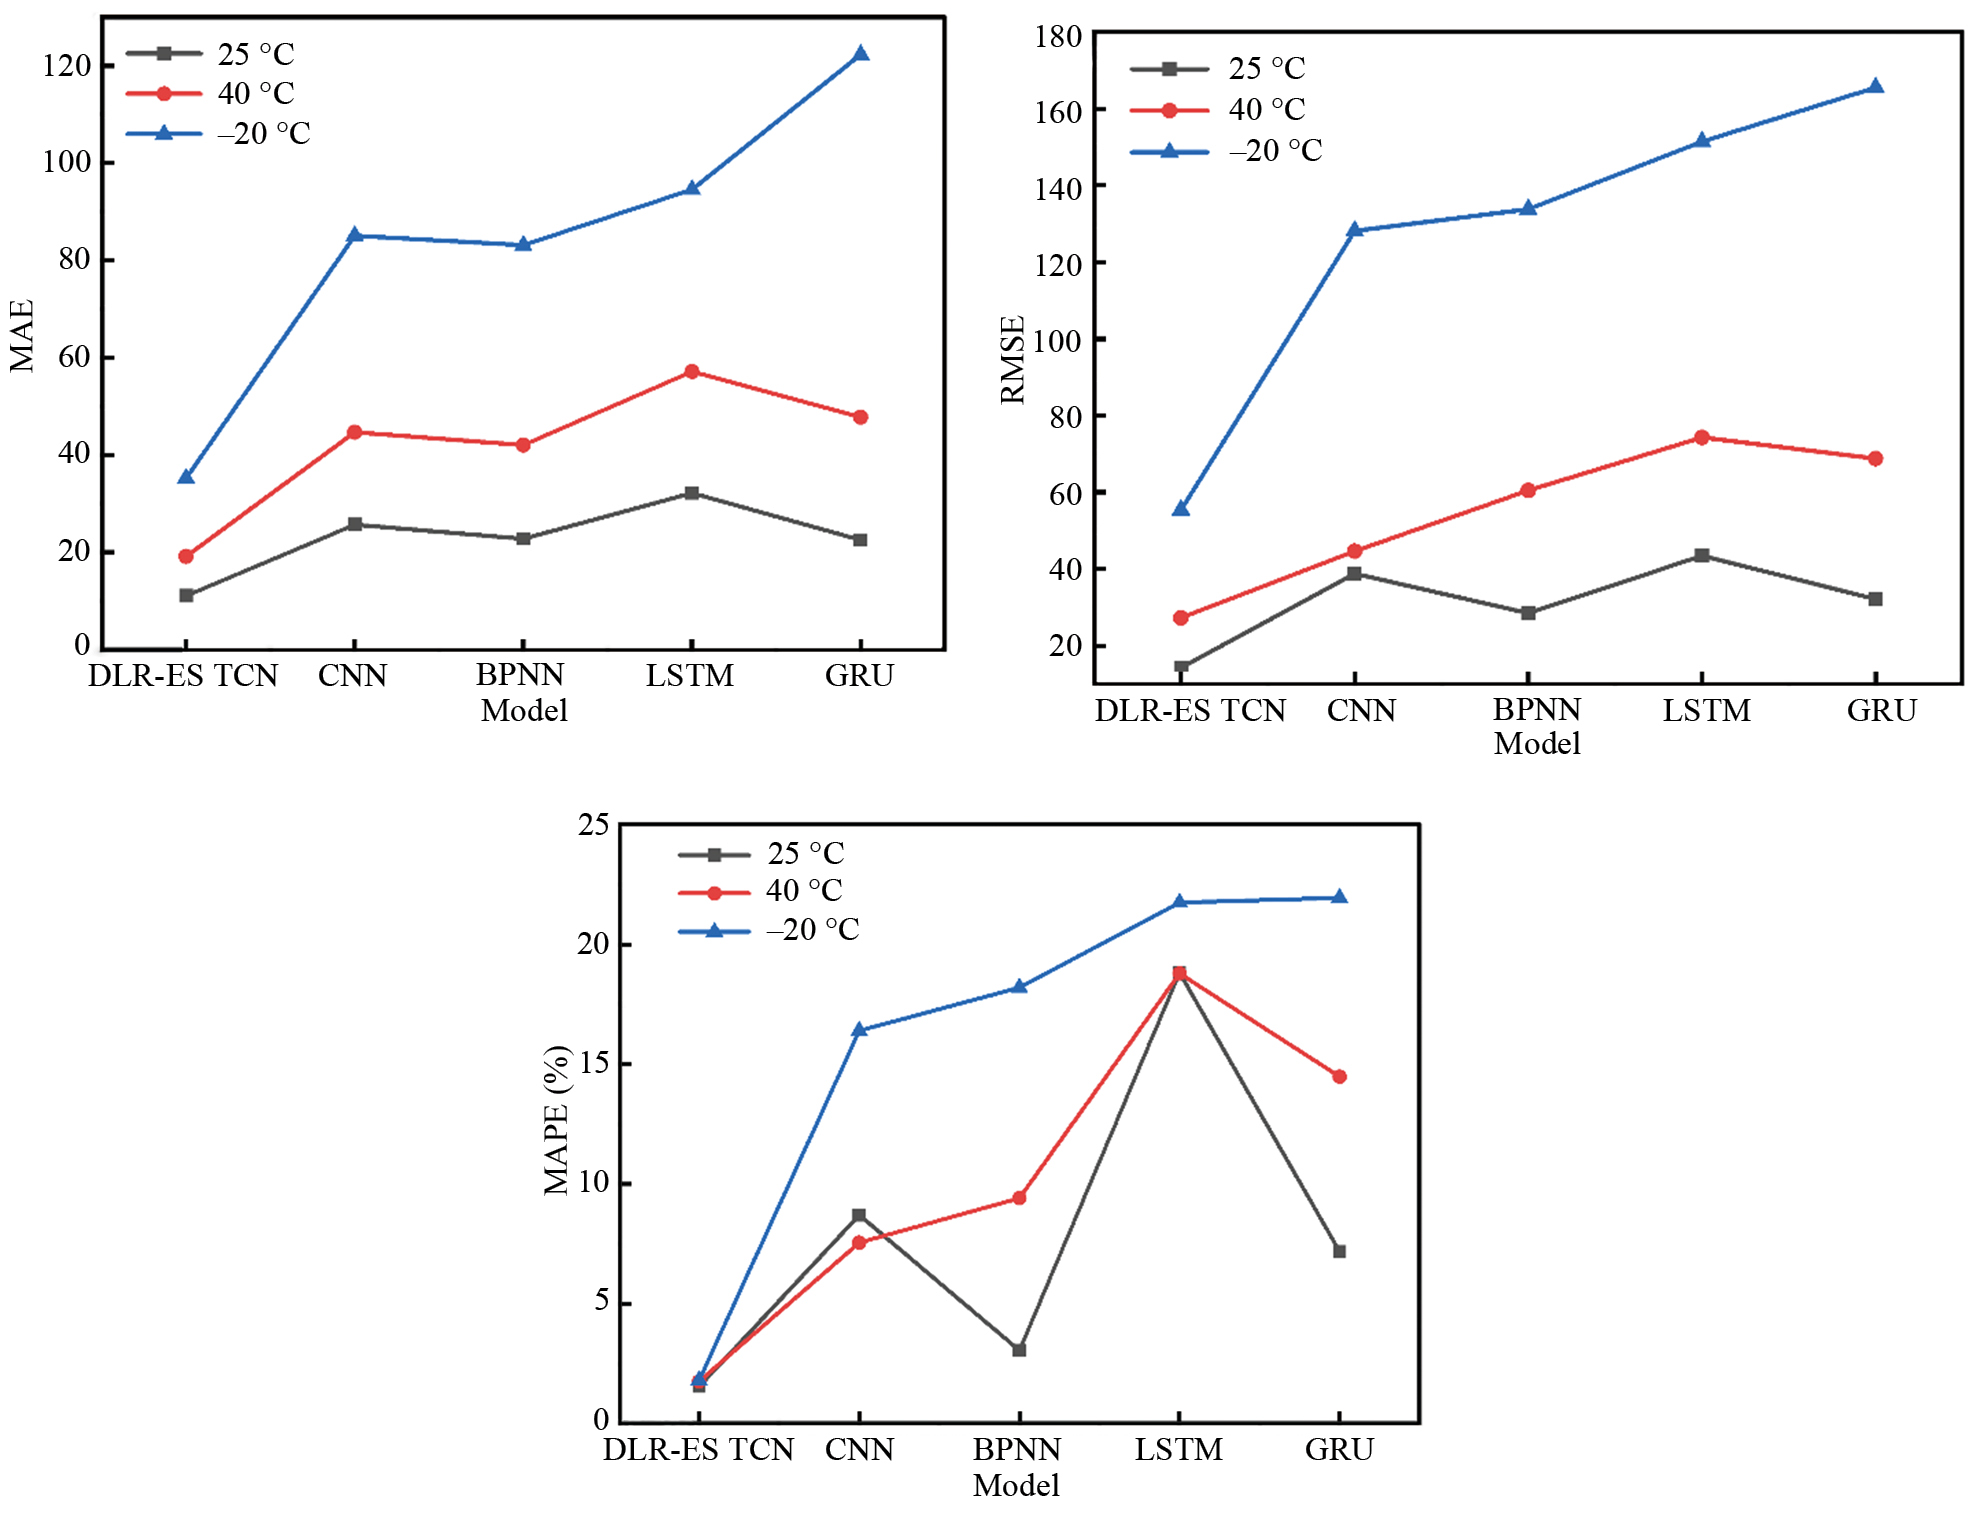
Table 4 shows the MAE, RMSE, and MAPE of each model at –20, 25, and 40 °C. Figure 12 shows the change curves of the MAE, RMSE, and MAPE for each model at different temperatures. In the quantitative analysis, the DLR-ES TCN model was superior to the comparison models. At different temperatures, the MAE and RMSE value of the DLR-ES TCN were less than 60. As shown in Table 4, the MAPE of the DLR-ES TCN at each temperature was smaller than that of the comparison model, and the error change curve shown in Fig. 13 indicates that the DLR-ES TCN model was more stable. Similarly, the DLR-ES TCN model was still effective under extreme weather conditions such as high and low temperatures, and its MAPE could be controlled within 2%. Based on the above experimental results, the proposed model was observed to perform better than the other models for RCT estimation.
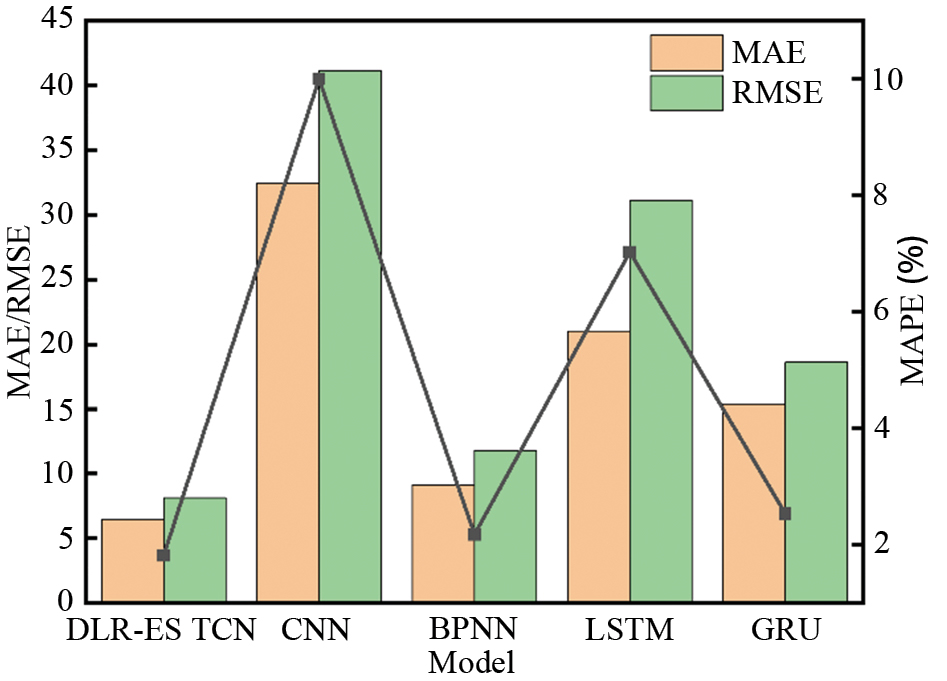
The experimental analysis confirmed that DLR-ES TCN model has better estimation performance. To verify the applicability of the model at different charging intervals, this section discusses the processing results of different models at room temperature and the optimal charging threshold. Similar to the estimation results at different temperatures, 100 samples were randomly selected from the test results to calculate the estimation results and RCT errors. As shown in Fig. 13, the DLR-ES TCN model had a better fit between its estimated and the actual values than the other models, and there is no obvious deviation. Figure 14 shown the MAE, RMSE, and MAPE values for the different models, which are listed in Table 5. The traditional CNN model had the most significant MAE, RMSE, and MAPE (32.41, 41.13, and 10%, respectively), whereas the DLR-ES TCN had the smallest MAE, RMSE, and MAPE (6.41, 8.14, and 1.82%, respectively), followed by the BPNN model, GRU, and LSTM models. The comparison results show that the DLR-ES TCN model based on the fast-charging strategy can not only obtain better prediction accuracy and stability in the full charging range of the battery but also have better estimation performance after setting the charging threshold during the charging process of the battery.
The proposed model was verified for its generalizability through supplementary experiments conducted on battery charging data under high-temperature slow charging. Figure 15 shows the RCT estimation results as well as the errors of different models for the slow charging dataset. Consistent with the above experiments, in order to visually observe the estimation results and errors, 100 test samples were randomly selected from the test results and plotted to visually observe the estimation results and errors. The diagram shows that the DLR-ES TCN model had a better fit between the estimated and the actual values, and the error range is smaller.
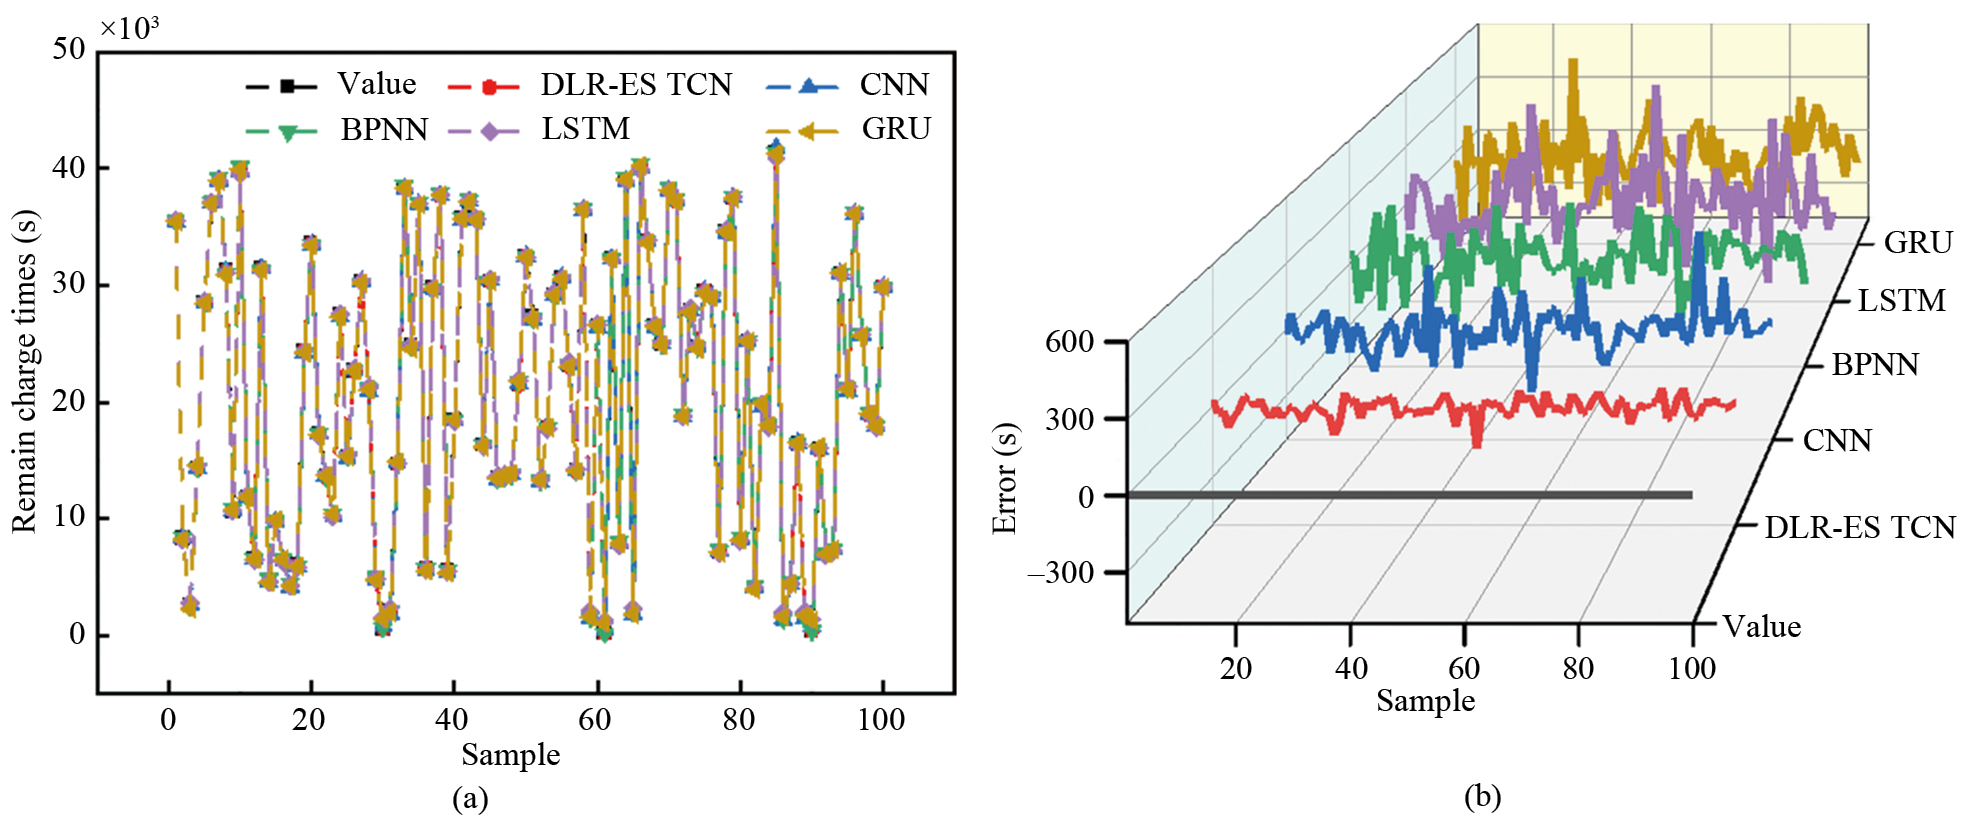
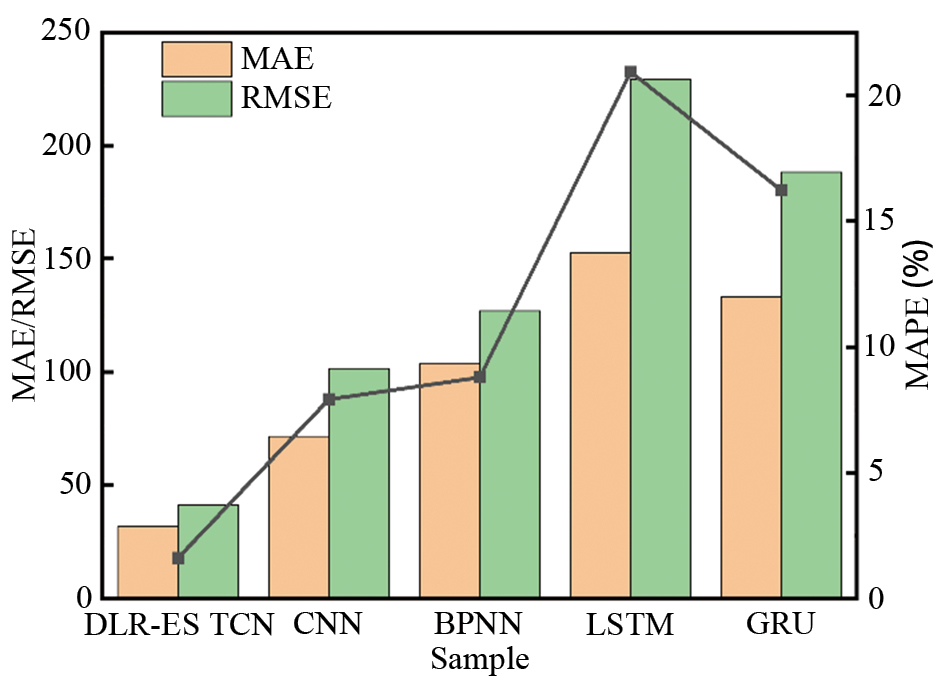
Table 6 and Fig. 16, show that the MAE and RMSE of the DLR-ES TCN model were the smallest (37.71, 41.29), followed by the those of traditional CNN, BPNN, and GRU models, and the error of the LSTM model was the largest (133.09, 229.19). The MAE values of the DLR-ES TCN model were 55.74%, 69.39%, 76.71%, and 79.22% lower than those of the CNN, BPNN, GRU, and LSTM models, respectively. The RMSE decreased by 59.38%, 75.05%, 81.98%, and 78.07%, respectively, and the MAPE error of the DLR-ES TCN model was controlled at 2%. Based on the performance indicators of the model, the DLR-ES TCN model uses dilated convolution to eliminate redundant information and mines effective information between neurons to train the model and improve its accuracy. The proposed method still had an estimation performance in the data set of slow-charging strategies, indicating that the model has well generalization robustness.
This paper proposes a deep learning framework based on actual charging scenarios for RCT estimation in multiple scenarios. The contribution and improvements of this study focus primarily on three aspects. (1) Charging a lithium-ion battery under different charging scenarios. (2) Analyzing the charging curve, including the source and current data such as charging current, voltage, cell temperature, and RCT. 3) According to different charging scenarios, the DLR-ES TCN model is proposed for estimation, which achieves an adaptive learning rate, model overfitting, and improves the generalization ability and estimation performance of the model.
To verify the proposed method, the and model evaluation indices were compared. The proposed method has been rigorously validated through systematic experiments, confirming its accuracy and robustness. The experimental results consistently demonstrate the reliable performance of the proposed method in estimating battery RCT, which can be used as a versatile model applicable to different charging scenarios. For different charging temperature conditions, the MAE of the model was less than 35.2, and the RMSE was less than 55.38. In the slow charging strategy, the MAE was less than 32 and the RMSE was less than 42. In the optimal charging threshold, the MAE was less than 7 and the RMSE is less than 9. Moreover, the MAPE of the DLR-ES TCN model was always within 2% in the verification above. In addition, this study compared the estimation performance with conventional CNN, LSTM model, GRU, and the BPNN models. The results indicate that the DLR-ES TCN model exhibits higher accuracy, better generalization ability, and greater robustness.
The multi-scenario estimation framework proposed in this paper still has the following limitations: (1) Applications for different types of batteries are not considered. (2) Not verified in the charging scenario after battery aging. In future research, we will extend the validation scope to more different battery types and charging scenarios after considering battery ageing factors to verify the accuracy of the proposed estimation framework. In the meantime, future research should seek to establish a more detailed joint estimation framework to better achieve the joint estimation of multiple battery state estimations and confirm its feasibility in practical applications. Moreover, other optimization algorithms can be injected into the model construction, thereby reducing model-related uncertainty, which requires further research and verification. In addition, with the rapid development of 5G technology and the application of cloud platforms and big data technology in battery state estimation, the proposed method can be applied to 5G-cloud BMS in the future.
Jianhui Mou: Formal analysis, Funding acquisition, Investigation, Supervision, Validation, Writing – review & editing. Chengcheng Yu: Data curation, Formal analysis, Investigation, Methodology, Software, Validation, Visualization, Funding acquisition, Writing – original draft, Writing – review & editing. Peiyong Duan: Funding acquisition, Supervision. Junjie Li: Data curation, Formal analysis, Project administration, Resources, Supervision, Visualization, Writing – review & editing. Chunjiang Zhang: Investigation, Validation, Resources. Yuhui Liu: Investigation, Methodology, Validation. Xinhua Liu: Conceptualization, Formal analysis, Writing – review & editing. Akhil GARG: Project administration, Formal analysis, Visualization. Shaosen Su: Methodology, Visualization, Writing – review & editing.
This work was supported in part by the National Natural Science Foundation of China (Grant No. 5217051006), the Shandong Province Natural Science Foundation (Grant No. ZR2021ME223), the Yantai Science and Technology Planning Project (Grant No. 2022GCCRC158), the Graduate Innovation Foundation of Yantai University, GIFYTU (Grant No. GGIFYTU2349). The authors gratefully acknowledge the great help of the fund.
Research and Markets, “Global new energy car market - Forecasts from 2022 to 2027,”https://www.researchandmarkets.com/reports/5649025/global-new-energy-car-market-forecasts-from#src-pos-1.%202023 (accessed May 1, 2023).
International Energy Agency, “Global EV Outlook 2023,”https://www.iea.org/events/global-ev-outlook-2023 (accessed May 15, 2023).
W. L. Shang, J. Y. Chen, H. B. Bi, Y. Sui, Y. Y. Chen, and H. T. Yu. “Impacts of COVID-19 pandemic on user behaviors and environmental benefits of bike sharing: A big-data analysis,” Applied Energy, vol. 285, p. 116429, 2021.
J. Rogelj, D. Huppmann, V. Krey, K. Riahi, L. Clarke, M. Gidden, Z. Nicholls, and M. Meinshausen, “A new scenario logic for the Paris Agreement long-term temperature goal,” Nature, vol. 573, no. 7774, pp. 357-363, 2019.
K. L. Liu, Z. B. Wei, C. H. Zhang, Y. L. Shang, R. Teodorescu, Q. L. Han, “Teodorescu Towards long lifetime battery: AI-based manufacturing and management,” IEEE/CAA Journal of Automatica Sinica, vol. 9, no. 7, pp. 1139-1165, 2022.
C. W. Hsu, R. Xiong, N. Y. Chen, J. Li, and N. T. Tsou. “Deep neural network battery life and voltage prediction by using data of one cycle only,” Applied Energy, vol. 306, p. 118134, 2022.
C. Y. Wang, N. X. Cui, C. L. Li, and C. H. Zhang. “State of power prediction based on electro-thermal battery model and multi-parameter constraints for lithium-ion battery,” Journal of Mechanical Engineering, vol. 55, no. 20, p. 114324, 2019.
Y. J. Zhang, H. W. Wang, X. N. Feng, M. G. Ouyang, A. J. Zhou, L. Su, and H. Q. Yang. “Research progress on thermal runaway combustion characteristics of power lithium-ion batteries,” Journal of Mechanical Engineering, vol. 55, no. 20, pp. 17-27, 2019.
Y. J. Wang and Z. H. Chen. “A framework for state-of-charge and remaining discharge time prediction using unscented particle filter,” Applied Energy, vol. 260, pp. 114324, 2020.
J. G. Wang, S. D. Zhang, C. Y. Li, L. F. Wu, Y. Z. Wang. “A data-driven method with mode decomposition mechanism for remaining useful life prediction of lithium-ion batteries,” IEEE Transactions on Power Electronics, vol. 37, no. 11, pp. 13684-13695, 2022.
S. X. Liu, Y. F. Zhou, Y. L. Liu, J. Lian, L. J. Huang. A method for battery health estimation based on charging time segment,” Energies, vol. 14, no. 9, pp. 2612, 2021.
M. L. Di Silvestre, E. Riva Sanseverino, G. Zizzo, G. Gradii, “An optimization approach for efficient management of EV parking lots with batteries recharging facilities,” Journal of Ambient Intelligence and Humanized Computing, vol. 4, pp. 641-649, 2013.
S. S. Su, W. Li, A. Garg, L. Gao. “An adaptive boosting charging strategy optimization based on thermoelectric-aging model, surrogates and multi-objective optimization,” Applied Energy, vol. 312, p. 118795, 2022.
J. S. Moon, J. H. Lee, I. Y. Ha, T. K. Lee, C. Y. Won. “An efficient battery charging algorithm based on state-of-charge estimation for electric vehicle,”2011 International Conference on Electrical Machines and Systems. IEEE, 2011, pp. 1–6.
J. Z. Shi, M. Tian, S. W. Han, T. Y. Wu, and Y. F. Tang. “Electric vehicle battery remaining charging time estimation considering charging accuracy and charging profile prediction,” Journal of Energy Storage, vol. 49, p. 104132, 2022.
D. Zhou, W. B. Zheng, P. Fu, and X. L. Pan. “Research on online estimation of available capacity of lithium batteries based on daily charging data,” Journal of Power Sources, vol. 451, p. 227713, 2020. https://doi.org/10.1016/j.jpowsour.2020.227713.
M. Torchio, N. A. Wolff, D. M. Raimondo, L. Magni, U. Krewer, R. B. Gopaluni, J. A. Paulson, and R. D. Braatz. “Real-time model predictive control for the optimal charging of a lithium-ion battery,”2015 American Control Conference (ACC). IEEE, 2015, pp. 4536–4541.
A. Abdollahi, X. Han, G. V.Avvari, N. Raghunathan, B. Balasingam, K. R. Pattipati, and Y. Bar-Shalom. “Optimal battery charging, Part I: Minimizing time-to-charge, energy loss, and temperature rise for OCV-resistance battery model,” Journal of Power Sources, vol. 303, pp. 388-398, 2016.
X. Hu, S. B. Li, H. E. Peng, and F. C. Sun, “Charging time and loss optimization for LiNMC and LiFePO4 batteries based on equivalent circuit models,” Journal of Power Sources, vol. 239, pp. 449-457, 2013. https://doi.org/10.1016/j.jpowsour.2013.03.157
G. Trentadue, A. Lucas, M. Otura, K. Pliakostathis, M. Zanni, and H. Scholz, “Evaluation of fast charging efficiency under extreme temperatures. Energies2018, vol. 11, no. 8, p. 1937, 2018.
T. Nazghelichi, F. Torabi, and V. Esfahanian. “Reducing the charging time of a lead–acid cell in the sense of linear stability analysis,” Journal of Energy Storage, vol. 36, p. 102369, 2021.
P. C. Lin. “Tri-Section SVR model for predicting charging time of lithium-ion batteries,” Chinese Journal of Power Sources, vol. 042, no. 008, pp. 1155-1157,1232, 2018.
S. Y. Cheng, P. C. Lin, and P. J. Lin. “New method of predict remaining charging time for lithium-ion batteries,” Chinese Journal of Power Sources, vol. 43, no. 1, pp. 99-135, 2019.
Y. F. Xie, F. Li, D. Cheng, X. Y. Wang, and Y. J. Feng. “A new energy vehicle charging time prediction method based on machine learning,” Modern Industrial Economy and Informaionization, vol. 12, no. 2, pp. 100-102, 2022.
H. F. Yang and S. F. Wu. “Prediction of remaining time of tram charging based on Bi-GRU,”in Proceedings of the 3rd Asia-Pacific Conference on Image Processing, Electronics and Computers. 2022, pp. 521–524.
J. Y. Du, X. Liu, Q. L. Liu, and J. C. Wang. “Prediction of remaining time of lithium battery charging based on indy-lstm,” Computer Applications and Software, vol. 38 no. 05, pp. 112-116, 2021.
W. D. Fang, C. D. Xu, J. S. Pan, H. L. Chen, and S. Wang, “A method of prediction of charging time based on lstm neural network, ” Journal of Network Intelligence, vol. 6, pp. 339-349, 2021.
K. N. Kumar, P. H. Cheah, B. Sivaneasan, P. L. So, and D. Z. W. Wang, “Electric vehicle charging profile prediction for efficient energy management in buildings,”2012 10th International Power & Energy Conference (IPEC). IEEE, 2012, pp. 480–485.
Y. Ma, M. B. Yao, H. C. Liu, and Z. H. Tang, “State of health estimation and remaining useful life prediction for lithium-ion batteries by improved particle swarm optimization-back propagation neural network,” Journal of Energy Storage, vol. 52, p. 14750, 2022.
M. K. Chai, F. Xia, S. T. Hao, D. G. Peng, C. G. Cui, and W. Liu, “PV power prediction based on LSTM with adaptive hyperparameter adjustment,” IEEE Access, vol. 7 pp. 115473-115486, 2019.
B. Sun, J. L. Pan, Z. Y. Wu, Q. Xia, Z. L. Wang, Y. Ren, D. Z. Yang, X. Guo, and Q. Feng, “Adaptive evolution enhanced physics-informed neural networks for time-variant health prognosis of lithium-ion batteries,” Journal of Power Sources, vol. 556, p. 232432, 2023.
Y. F. Liu, J. Q. Li, G. Zhang, B. Hua, and N. Xiong, “State of charge estimation of lithium-ion batteries based on temporal convolutional network and transfer learning,” IEEE Access, vol. 9, pp. 34177-34187, 2021.
M. Khanra and A. K. Nandi. “Optimal driving based trip planning of electric vehicles using evolutionary algorithms: A driving assistance system,” Applied Soft Computing, vol. 93, p. 106361, 2020.
Z. W. Deng, L. Xu, H. G. Liu, X. S. Xu, Z. X. Duan, and Y. Xu, “Prognostics of battery capacity based on charging data and data-driven methods for on-road vehicles,” Applied Energy, vol. 339, p. 120954, 2023.
G. Cai, T. Dong, Y. Li, et al.Fast Charging Characteristics of Lithium-ion Power Batteries at Different Temperatures [J]. Environmental Technology, no. S01, p. 039(59-66?), 2021. https://doi.org/1004-7204(2021)S1-0059-04.
S. J. Bai, J. Z. Kolter, and V. Koltun, “An empirical evaluation of generic convolutional and recurrent networks for sequence modeling,” arXiv preprint arXiv:1803.01271, 2018. https://doi.org/10.48550/arXiv.1803.01271.
P. Lara-Benítez, M. Carranza-García, J. M. Luna-Romera, and J. C. Riquelme, “Temporal convolutional networks applied to energy-related time series forecasting,” Applied Sciences, 2020, vol. 10, no. 7, p. 2322, 2020.
J. Long, E. Shelhamer, and T. Darrell. “Fully convolutional networks for semantic segmentation,” Proceedings of the IEEE Conference on Computer Vision and Pattern Recognition., 2015, pp. 3431-3440.
A. Oord, S. Dieleman, H. Zen, K. Simonyan, O. Vinyals, A. Graves, N. Kalchbrenner, A. Senior, and K. Kavukcuoglu, “Wavenet: A generative model for raw audio,” arXiv preprint arXiv:1609.03499, 2016. https://doi.org/10.48550/arXiv.1609.03499.
F. Yu and V. Koltun, “Multi-scale context aggregation by dilated convolutions,” arXiv preprint arXiv:1511.07122, 2015. https://doi.org/10.48550/arXiv.1511.07122.
W. T. Zhao, Y. Y. Gao, T. X. Ji, F. Ye, and G. W. Bai, “Deep temporal convolutional networks for short-term traffic flow forecasting,” IEEE Access, vol. 7, pp. 114496-114507, 2019.
K. M. He, X. Y. Zhang, S. Q. Ren, and J. Sun, “Deep residual learning for image recognition,”in Proceedings of the IEEE Conference on Computer Vision and Pattern Recognition. 2016, pp. 770–778.
N. Srivastava, G. Hinton, A. Krizhevsky, H. Sutskever, and R. Salakhutdinov, “Dropout: a simple way to prevent neural networks from overfitting,” Journal of Machine Learning Research, vol. 15, no. 1, pp. 1929-1958, 2014.
J. J. Zhang, F. Hu, L. Li, X. F. Xu, and Z. B. Yang. “AEDR: An adaptive mechanism to achieve online learning rate dynamically,”2017 IEEE 29th International Conference on Tools with Artificial Intelligence (ICTAI). IEEE, 2017, pp. 30–36.
 Top